Review

In-Situ Radar Observation of Shallow Lunar Regolith at the Chang’E-5 Landing Site: Research Progress and Perspectives

1
Institute of Advance Study, Shenzhen University, Shenzhen 518060, China
2
Institute of Moon-Base Exploration and Observation, Shenzhen University, Shenzhen 518060, China
3
Planetary Science Institute, 1700 East Fort Lowell, Tucson, AZ 85719, USA
4
Key Laboratory of Lunar and Deep Space Exploration, National Astronomical Observatories, Chinese Academy of Sciences, Beijing 100012, China
5
School of Astronomy and Space Science, University of Chinese Academy of Sciences, Beijing 100049, China
6
R.N.T. P.G. College, Kapasan 312202, India
7
School of Geosciences, University of Aberdeen, Kings College, Aberdeen AB24 3SW, UK
*
Author to whom correspondence should be addressed.
Remote Sens. 2023, 15(21), 5173; https://doi.org/10.3390/rs15215173
Submission received: 2 September 2023 / Revised: 12 October 2023 / Accepted: 20 October 2023 / Published: 30 October 2023
(This article belongs to the Special Issue Future of Lunar Exploration)

Abstract

:
China accomplished a historic milestone in 2020 when the mission Chang’e-5 (CE-5) to the Lunar’s surface was successfully launched. An extraordinary component of this mission is the “Lunar Regolith Penetrating Radar” (LRPR) housed within its lander, which currently stands as the most advanced payload in terms of vertical resolution among all penetrating radars employed in lunar exploration. This provides an unprecedented opportunity for high-precision research into the interior structure of the shallow lunar regolith. Previous studies have achieved fruitful research results based on the data from LRPR, updating our perception of the shallow-level regolith of the Moon. This paper provides an overview of the new advancements achieved by the LRPR in observing the basic structure of the shallow regolith of the Moon. It places special emphasis on the role played by the LRPR in revealing details about the shallow lunar regolith’s structure, its estimated dielectric properties, the provenance of the regolith materials from the landing area, and its interpretation of the geological stratification at the landing site. Lastly, it envisions the application and developmental trends of in situ radar technology in future lunar exploration.

1. Introduction

As the third phase, the CE-5 mission is part of the program of China’s lunar exploration, characterized by the sequential “orbit (the CE-1 and CE-2 mission [1,2,3]), land (the CE-3 mission and CE-4 [4,5,6,7]), and return (the CE-5 mission and future CE-6 mission [8,9,10,11,12])” strategy. In the year 2020, China achieved a significant triumph by flawlessly executing the landing of the CE-5 within the Mons Rumker region on the lunar’s near side (see Figure 1, [13]). The CE-5 mission achieved its objective, safely bringing back a substantial cache of 1731 g of collected lunar samples to Earth [14,15,16,17]. This mission gives a precious opportunity for scientists to answer many unresolved questions about the formation and evolution of the Moon’s surface and the physical properties of the lunar regolith [11,18,19,20,21,22,23,24,25,26]. This landmark achievement underscores the resounding success of the initial three stages constituting China’s lunar exploration endeavor. In 2021, the China National Space Administration (CNSA) announced the approval of the fourth phase of the program of China’s lunar exploration, which is expected to establish an international lunar base on the Moon around the year 2028. Currently, three years have passed since the successful launch of the CE-5 mission, and scientists have made significant scientific achievements using the lunar samples and payloads carried by the CE-5 spacecraft [11,23,27,28,29,30,31,32,33]. Notably, the radar instrument onboard the CE-5 lander has been utilized to assist in the drilling process for drilling lunar samples [17,23]. Additionally, the LRPR represents the first deployment of an array antenna with high precision for observing the shallow lunar regolith structure [23,34,35].
To precisely investigate the internal structure of the shallow subsurface of the lunar down to a depth of around ∼3 m is the main scientific goal of the LRPR that the CE-5 lander carried [23,34,35]. In the lunar case, a layer of loose regolith material covers the shallow subsurface [36]. Its regolith is the product of space weathering and meteoroid impacts on its surface [36], and its thickness varies across the Moon, often being about ∼5 m in mare region and up to ∼10 m in highland regions [37,38,39]. According to earlier research, the interior of the shallow regolith is made up mostly of fine-grained type of regolith, and mixed with some rock fragments from ejecta [7,40,41,42,43]. The amount of rock fragments in the shallow regolith relies on the maturity of the local regolith and is closely correlated with the geological age of the surface in the area [44]. Generally, the lunar geological units with older geological ages exhibit higher regolith maturity and lower rock fragments [44]. Optical methods (e.g., spectrum and camera) lack penetrative capabilities, making radar a primary tool for investigating the shallow regolith’s internal structure [6,45,46]. The depth of the deepest drilling core collected during the Apollo 17 mission was about ∼3 m [47], although the detection area of the drilling core is constrained. Drilling samples have been utilized to explore the lunar regolith’s internal structure [48,49,50]. Therefore, it can be said that in-situ radar is a potent instrument for subsurface investigation [7,40,41,51,52,53]. The CE-3 was the first mission to deploy a ground-penetrating radar for lunar surface exploration, with its high-frequency radar achieving a resolution of 0.3 m within the lunar regolith [5,51,54], and the CE-5 radar has a resolution of ∼5 cm within the lunar regolith [34,35]. The basic parameters of the CE-3 and CE-5 radars can be found in detail in Table 1. Therefore, the radar on CE-5 can disclose more precise structural data on the shallow level of the subsurface.
This paper will give an outline of the most recent research successes attained by the CE-5 radar. It focuses on description of the lunar regolith detection instrument, LRPR (see Section 3), radar imaging algorithms (see Section 3.5), radar-based observation of the landing area’s shallow subsurface structure (see Section 4.2), estimation of the lunar regolith’s loss tangent and dielectric permittivity in the landing region (Section 5), the provenance analysis of lunar’s regolith at landing area (see Section 6), and the geological stratigraphy interpretation of the radar observations (see Section 7).

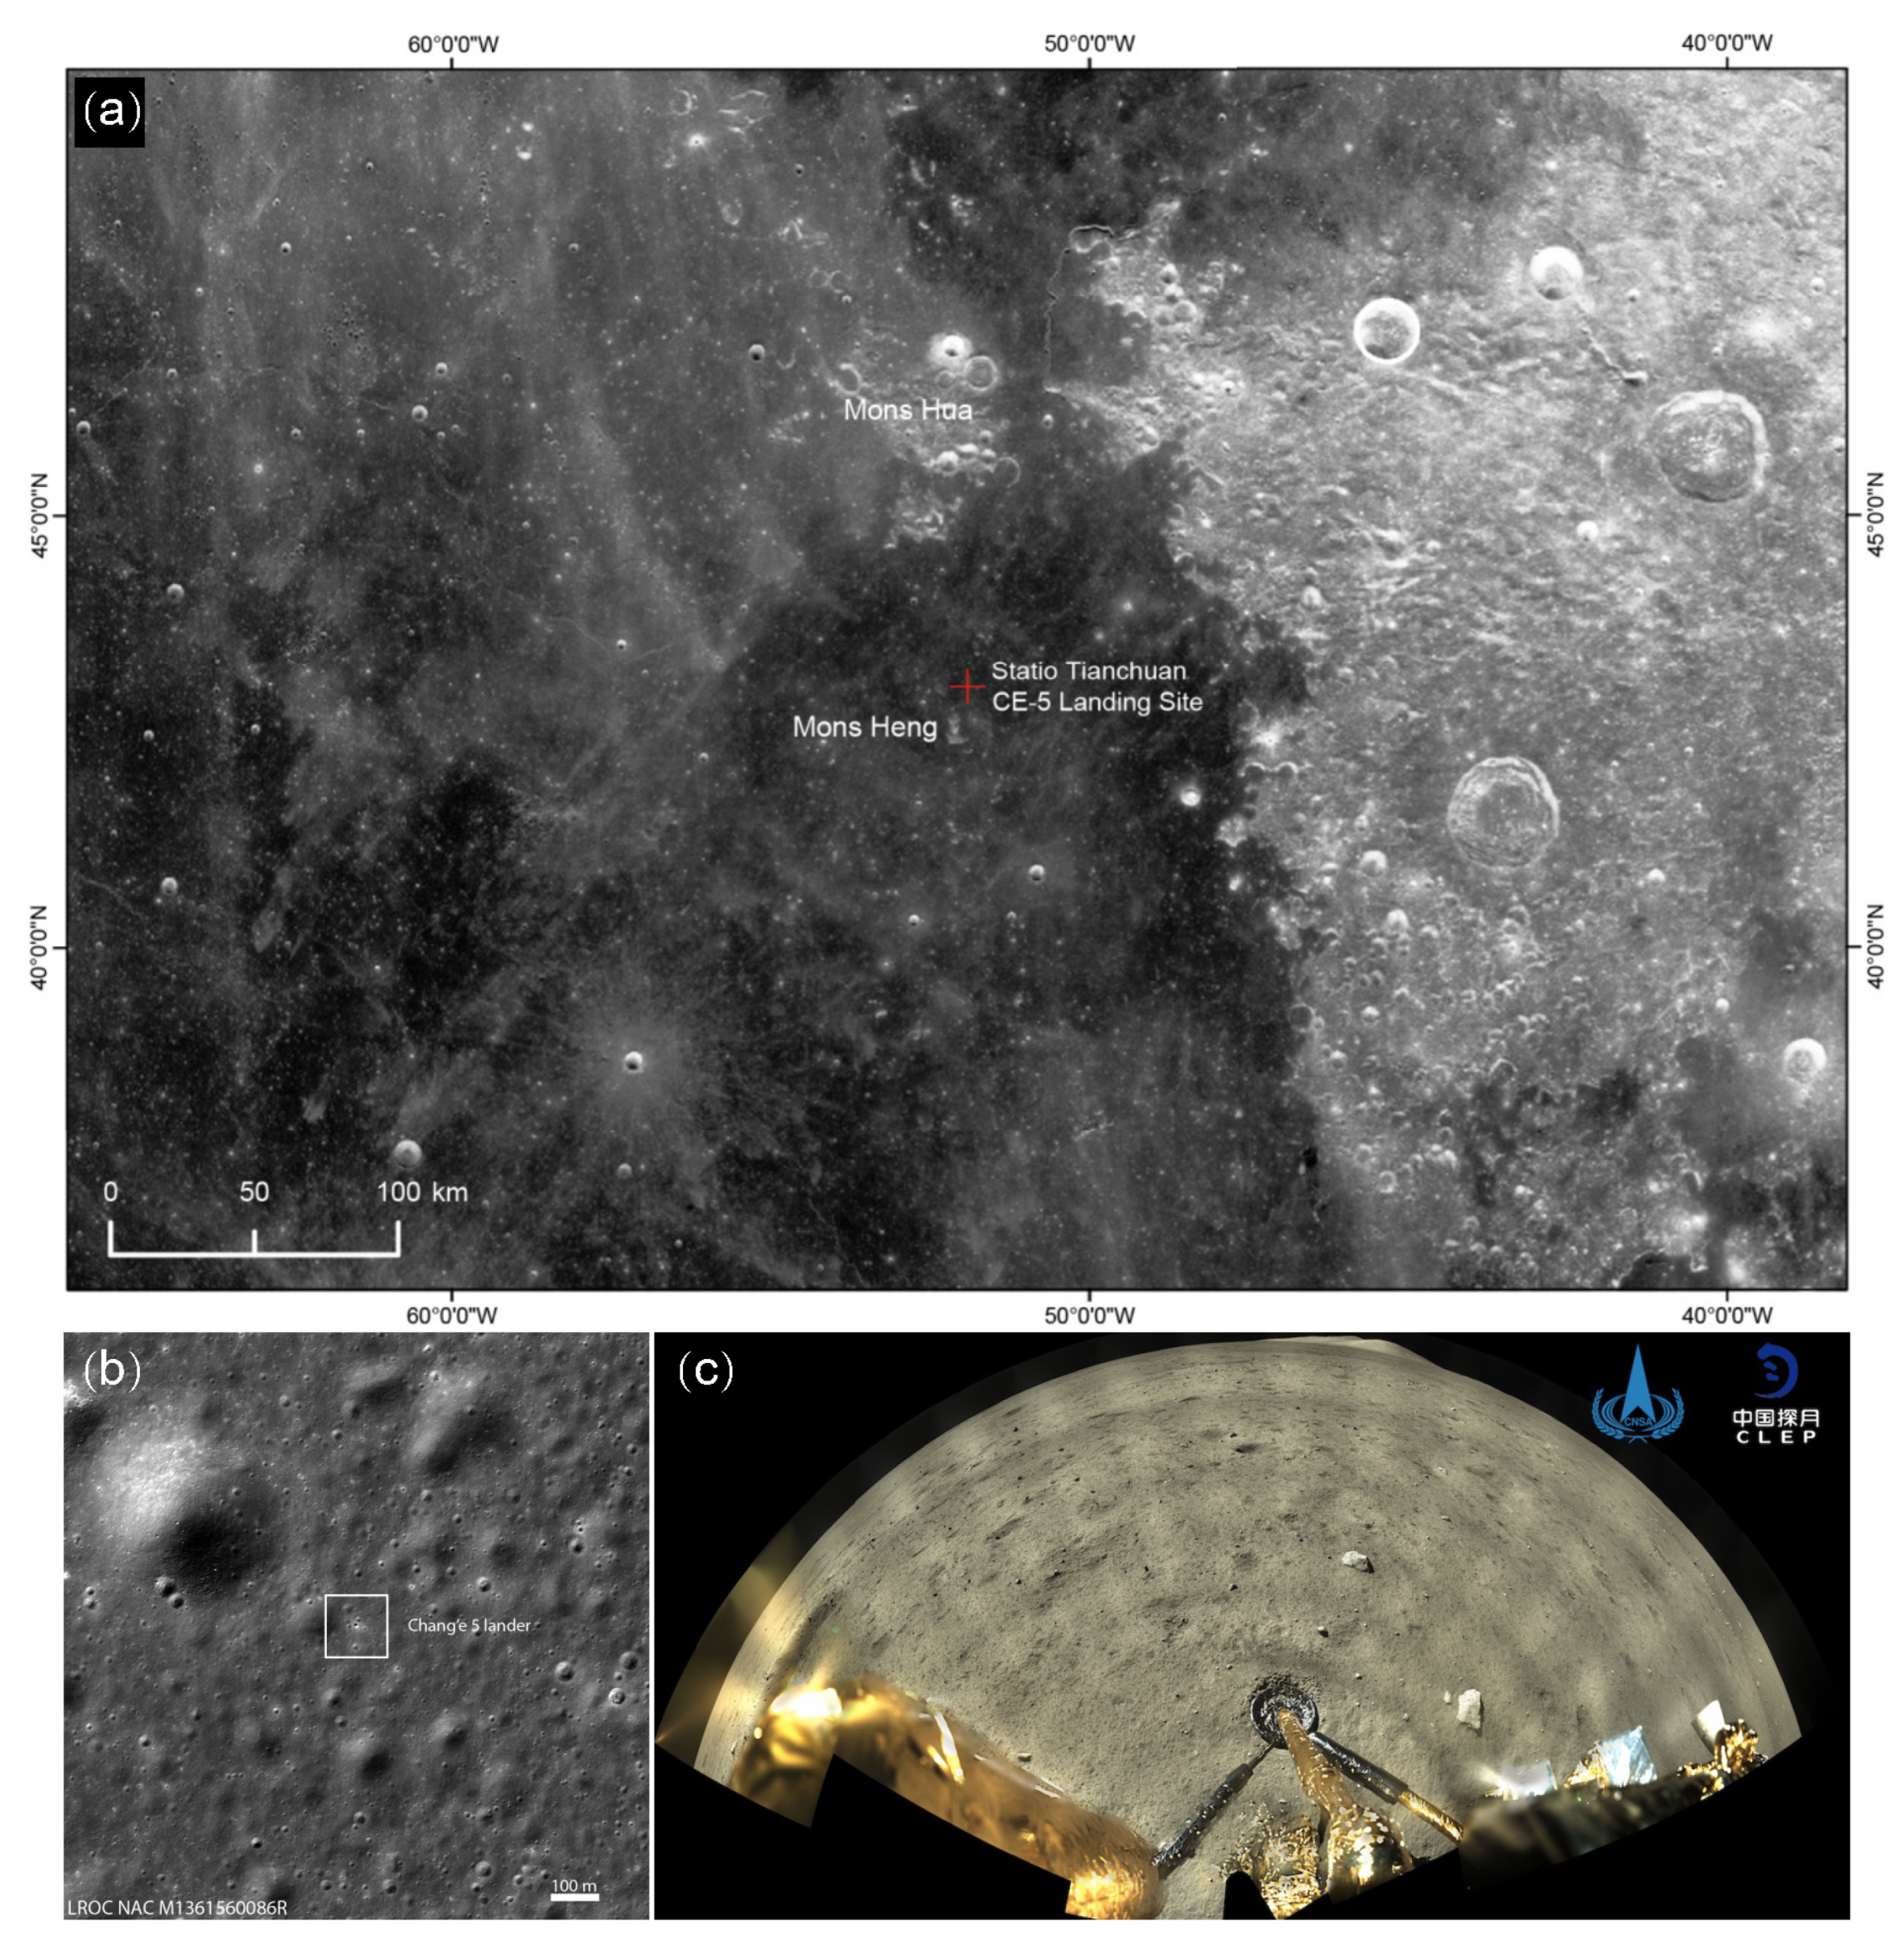
2. Geological Setting of the CE-5 Landing Zone

On the Moon, CE-5 made a successful landing in the Oceanus Procellarum region [14,56]. The precise coordinates for the CE-5 landing site are 43.06 latitude and 51.92 longitude [57]. P58 is the location of the landing site, which is defined by Hiesinger et al. [58]. The P58 geological unit is ranked as the 58th among the 60 geological units in the Oceanus Procellarum [58]. Prior to the CE-5 mission, it had not been explored by any in-situ measurement. It is also one of the youngest mare regions on the lunar surface, making it a suitable choice for the landing site due to it allows for the collection of samples from the youngest geological unit, facilitating geological research [59]. Additionally, its relatively gentle terrain facilitates the landing of the lander [60]. There was another alternative landing site located in the southern region at approximately 43 ± 2 S and 59 ± 10 W. However, it was not chosen as the primary landing site because it lacked diverse topographical features and relatively high research value compared to the current landing area [59].
The P58 has a 1.2 to 3 Ga range in absolute model age [61,62,63,64], and was constrained as 2.0 Ga by measurement of the lunar samples [65,66]. The chosen landing site is located at a distance of around 150 km from a dome-shaped volcanic feature Mons Rumker, it encompasses a lava plateau with a total area of ∼4000 km 2 [67]. Rima Sharp, the Moon’s longest sinuous type of rille whose length is ∼566 km, lies 17 km from the area’s boundary [68,69]. Within the landing area, there are numerous wrinkle ridges, with the closest one located about 2 km away from the landing site [69].
In the context of CE-5’s landing zone, the lava fields exhibit very low slopes (∼2.7 ) and moderately flat terrain [60]. Numerous impact craters of small size (less than 1 km in diameter) are present in the vicinity of this region. The largest nearby crater is situated approximately 6 km northwest of the landing site with a diameter of ∼780 m [69]. In the 20 × 20 km region of the CE-5 landing site, surface content analysis suggests that the majority (92–96%) of the area contains between 16–19 wt% of FeO and 4–7 wt% of TiO 2 [69], as shown in Figure 2. The average FeO abundance is approximately 17.4 wt%, consistent with typical lunar mare basalts. The lunar mare basalts are fairly titanium-rich, as shown by the average TiO 2 abundance level of 5.9 wt% [69]. The levels of FeO and TiO 2 on the surface of the lunar have a direct impact on how well electromagnetic radar waves can penetrate the surface [46]. It is clear from Figure 2, that the material composition of the CE-5 landing site has radar electromagnetic wave absorption characteristics that are comparable to those of the CE-3 landing site [42,70,71].

3. Lunar Regolith Penetrating Radar (LRPR)

3.1. Concise Description of the CE-5 Radar System

The CE-5 lander’s LRPR is a time-domain pulsed radar designed for subsurface detection on the Moon [34,35]. The CE-5 radar employs a time-domain technology rather than a frequency-domain technology, primarily due to the well-established and engineering-friendly nature of time-domain radar technology. Furthermore, it has already been successfully applied in the earlier CE-3 and CE-4 missions. While frequency-domain radar offers higher resolution and greater penetration capabilities compared to time-domain radar [72,73], the design of its radar system is more complex, and its system stability is inferior to that of time-domain radar. Generally, the preference for payload design tends to favor mature technology and stable systems in lunar exploration.
For the first time in history, antenna array radar has been used for lunar exploration and subsurface investigation [55]. It consists of 12 irregularly arranged butterfly antennas (Figure 3), and it works between the frequencies of 1–3 GHz (for detailed parameters, refer to Table 1). The LRPR’s basic operating concept is as follows [12,34,35,55]: one antenna emits an ultra-wideband carrier-free picoseconds pulse signal towards the lunar surface, generating electromagnetic waves that penetrate the lunar regolith. Simultaneously, the other 11 antennas receive signals reflected from points or surfaces with different electromagnetic properties in the surrounding medium.
A total of 132 data traces with a time window of 55 ns and a time sampling interval of 18.3 ps are produced and received by the 12 antennas [34]. When stationary, the LRPR can transmit data on the surface to the subsurface depth of ∼2 m [23,74,75]. Through the analysis of the radar dataset, imaging of the drilling area can be achieved, providing valuable information support for drilling and sampling collection [23,35].
The main objective of the radar carried on the CE-5 lander is to assist in drilling and sampling activities, providing real-time observations of the subsurface conditions of the lunar regolith. Another scientific goal is to investigate the fine structure of the lunar regolith. The radar is designed to be positioned on the bottom of the lander and is not capable of mobility. Its detection range in the horizontal direction is limited to 1.5 m. The CE-5’s radar characteristics are different from those of its forerunners, e.g., the CE-3 & CE-4 radars (Table 1). The CE-5 radar operates at a higher frequency (e.g., 2 GHz), whereas the high-frequency radar frequencies of CE-3 and CE-4 are at 500 MHz. This higher frequency allows CE-5 radar to achieve a higher vertical resolution (e.g., 5 cm in lunar regolith), compared to the corresponding performance of 0.3 m for CE-3 and CE-4 high-frequency radar [7,34,54]. However, the penetration depth of the CE-5 radar is not as deep as that of the CE-3 and CE-4. This difference in frequency design is related to their respective scientific objectives. To aid in drilling regolith cores of the lunar, the CE-5 mission has been launched, providing detailed interpretations of the shallow internal structure of the lunar regolith [23,34]. In contrast to the high-frequency LRPR radar used in CE-5, the Lunar Penetrating Radar (LPR) carried by CE-3 and CE-4 operates at relatively lower frequencies to perform penetrating observations [5,76,77]. The LPR is a surface penetrating radar that works in the time domain [54], and the LPR radar consists of two detection channels. The first channel is called “CH1” and operates between 40 and 80 MHz, having capabilities to penetrate the subsurface depth of many ∼100 m with high vertical resolution [40,54,70]. Along the rover’s route, this channel is utilized to identify the crust structure of the lunar at a shallow level. The second channel is called “CH2” and operates between 250–750 MHz [54]. Its vertical resolution is about <30 cm and its penetration depth is around 50 m [78]. Along the Yutu rover’s course of travel, this channel is utilized to investigate the structure thickness of the regolith of the Moon [7,51].

3.2. Preprocessing of Radar Data

The LRPR radar undergoes several preprocessing steps before radar data imaging, as detailed including [79]:
  • Sample time calibration: This procedure is conducted to rectify any irregularities in the sampling interval, ensuring uniformity. The sampling time intervals at the instrument level are not constant. Therefore, we need to access the sampling time axis data to calibrate the radar observation. The sampling time axis data represents the actual sampling times of each sampling point when the LRPR acquires a scientific dataset. This data is obtained through ground calibration experiments. The actual scientific data’s time axis data can be obtained by using the parameter “sampling start position” to look up the actual sampling time for each point within the sampling time axis data.
  • Bandpass filtering: This step is employed to effectively eliminate system noise and direct current components.
  • Delay correction: LRPR employs a single transmitter and a single receiver, and different channels are switched using a switching matrix, resulting in varying delays in different channels. Delay correction is performed to address this issue.
  • Background removal: The signals emitted by the antenna undergo multiple couplings/reflections between the antenna and the lander, generating interference in the form of clutter that severely affects the imaging of underground targets. This step aims to remove such background noise.
Once the preprocessing is completed, radar imaging can be carried out to obtain radar images with reduced interference and improve the quality of the radar image.

3.3. Calibration or Ground Validation

The ground experiment is a crucial step in evaluating the radar detection capability and imaging algorithms. Before the CE-5 radar was launched, Xiao et al. [34] and Li et al. [35] conducted extensive ground validation experiments. Figure 4a illustrates a full-scale model of a CE-5 lander equipped with the LRPR (shown in Figure 4b. The LRPR is positioned at the lower section of the lander, approximately 0.89 m above the lunar surface [34]. Directly below the model is a concrete pool (shown in Figure 4c) filled with simulated lunar regolith material made from volcanic ash [34]. The measured dimensions of the pool are depth, width, and length are 2.5 m, 3 m, and 7 m respectively. It contains buried target objects, such as metal spheres, square plastic plates, and irregularly shaped basalt rocks (shown in Figure 4e) [35].
Five ground measurement experiments were conducted by burying different target objects. The background of the surface echoes was also obtained in the experiment by measuring the surface of the simulation layer covered with the material absorbing the electromagnetic waves [79]. The results of radar images after different processing methods are shown in Figure 5.

3.4. Estimation of Velocity Spectrum of the Radar Image

The LRPR data goes through automatic gain control before velocity spectrum estimation to enhance weak signals from deeper levels and ensure that there is enough total energy. As the top and bottom of the simulated lunar regolith layer are flat. All midpoints fall within a comparatively smaller area than the LRPR aperture. The radar-observed data traces are considered as if they have an identical midpoint. Based on cross-correlations of the traces utilizing the common midpoint (CMP), the velocity spectrum analysis is conducted. The coherence of signals between various traces is computed along specific test velocities defined as trajectories or paths. The stacked coherence power can be plotted on a velocity-time image, and the coherence power varies with different test velocities [79].
The measurement of coherence is typically represented by the non-normalized type of cross-correlation and is given by the equation [80]:
C C ( τ , v ) = i = 1 N 1 j = i + 1 N A i , t i A j , t j + H i , t i H j , t j
N is the quantity of traces in the CMP set, while j and i are trace numbers. A i , t i , and H i , t i are the imaginary and real parts of LRPR data after Hilbert transform in the i t h trace at t i , and t i is determined by both the two-way zero offset travel (TZT) time and the experimentally derived propagation velocity v.
t i = x i 2 + v 2 τ 2 v
According to Equation (1), the envelope velocity spectrum can be obtained (as shown in Figure 6). Two peaks can be pinpointed at the spectrum’s upper and lower extremities, corresponding to pronounced reflection events occurring at the interface between the lunar regolith and vacuum layer, as well as at the bottom. The chosen time corresponds to the TZT time of these reflections, while the selected velocity is referred to as the stacking velocity. Additionally, the velocity of the lunar regolith layer can be calculated using the Dix formula [81]:
v int , 2 = v s t a , 2 2 τ 2 v s t a , 1 2 τ 1 τ 2 τ 1
where v s t a , 1 and v s t a , 2 represent the stacking velocity of the vacuum and regolith layer respectively. v i n t , 2 signifies the interval velocity, representing the speed of propagation for electromagnetic waves within the lunar regolith. After obtaining v i n t , 2 , the dielectric permittivity of the lunar regolith layer can be determined by establishing a relationship between dielectric permittivity and electromagnetic wave velocity. By applying the equation mentioned above, according to Feng et al. [79] electromagnetic waves in lunar regolith propagate at a speed of about 0.173 m/ns (Figure 6a). The speed at which electromagnetic waves typically propagate through lunar regolith is this [7,36].

3.5. Radar Imaging Algorithm

The research on LRPR radar imaging algorithms mainly includes Li et al. [75] and Feng et al. [79]. Li et al. [75] provide a migration imaging technique of an advanced prestack depth rooted in the Kirchhoff integral principle. Feng et al. [79] offer an imaging method that is derived from SAR (Synthetic Aperture Radar) validation and imaging by processed data from ground-based experiments [79]. Furthermore, the latest study also introduces an imaging technique grounded in synthetic imaging principles drawn from the field of radio astronomy [12].
The radar imaging algorithm of diffraction stacking migration is highly flexible and applicable to various array configurations. Its process entails the reverse-time back-propagation of each time-domain trace collected, effectively relocating the observed reflections to their accurate spatial positions. The array radar antenna data imaging algorithm used in the CE-5 mission mainly adopts this approach, e.g., Feng et al. [79] conducted detailed research on this algorithm. The main steps of the algorithm are as follows:
1. First step: Integrate the signals that have been propagated backward from traces all within the aperture of radar, culminating in the comprehensive computation of diffraction stacking for the region of migration. An improved migration formula using cross-correlation is used to achieve better imaging results, as shown in the following equation:
I ( x , z ) = i = 1 N 1 j = i + 1 N w i ( x , z ) · A i , Δ t i ( x , z ) · w j ( x , z ) · A j , Δ t j ( x , z ) + w i ( x , z ) · H i , Δ t i ( x , z ) · w j ( x , z ) · H j , Δ t j ( x , z )
where the y = 0 plane is taken as the migration plane. I ( x , z ) represents the reflection intensity at a certain point ( x , 0 , z ) . The weighting coefficient, w i ( x , z ) , is employed to account for compensating energy losses brought on by spherical spreading and medium absorption. Following the Hilbert transform, H i , Δ t i ( x , z ) and A i , Δ t i ( x , z ) represent imaginary and the real parts of the observation of radar at the trip time of two-way along the i-th trace.
2. Second step: Calculate the two-way travel time. For the time Δ t i ( x , z ) , it can be calculated based on the geometric relationships shown in Figure 6b using the following equation:
Δ t i ( x , z ) = ε 1 R T 1 + ε 2 R T 2 + ε 1 R R 1 + ε 2 R R 2 c
where the values of permittivity of two layers two as determined via velocity estimate are denoted by ε 1 and ε 2 , respectively. R T 1 , R T 2 , R R 1 , R R 2 represent the propagation paths of electromagnetic waves (as shown in Figure 6b), displayed as the following equations:
R R 1 = h 2 + d R i 2 + y R i 2 R R 2 = z 2 + x x R i d R i 2 + y R i 2 R T 1 = h 2 + d T i 2 + y T i 2 R T 2 = z 2 + x x T i d T i 2 + y T i 2
Their calculations can be combined with d T i , d R i (distances from the refractive points on the surface layer to the transmitting or receiving antenna), x T i , y T i , x R i , y R i (coordinates of the receiving and transmitting antennas for the i t h trace), and h (distance from the receiving and transmitting antennas to the lunar regolith). For d R i , it can be calculated according to Snell’s law, and d T i is the same as:
ε 2 d R i h 2 + d R i 2 = ε 1 x x R i d R i z 2 + x x R i d R i 2
3. Third step: Calculate the weighting coefficients for Equation (4). The weighting coefficients can be calculated using the following formula:
w i = R T 1 + R T 2 + R R 1 + R R 2 · exp α · R T 2 + R R 2
where α denotes the attenuation coefficient of electromagnetic waves within a medium characterized by losses, defined as:
α = 2 π λ 0 ε 2 1 2 1 + tan 2 δ 1 1 2
where λ 0 is the wavelength. The parameter tan δ is the loss tangent of the material for electromagnetic wave propagation. Typically, the loss tangent of lunar regolith is significantly less than 1 [36], and with an approximation, the above formula can be simplified to
α = π λ 0 ε 2 tan δ
4. The final step is to calculate Δ t j ( x , z ) and w j ( x , z ) similarly, then input the results into Equation (4) to compute the pixel value for each individual in the grid of the lunar regolith simulation. After calculating the pixel values for all, the migrated radar image can be obtained, as shown in Figure 7.
From Figure 7, we have noted that the interfaces between the vacuum/regolith layer and the metallic bottom are distinctly visible due to the presence of the most pronounced reflections. The plastic plates and metal spheres are imaged with precise localization, but the diffraction characteristics of electromagnetic waves obscure their exact physical size and shape. On the other hand, the radar images do not render a clear depiction of the basalt rocks. This can be attributed primarily to their relatively small radar cross-sections and irregular shapes. This suggests that accurately imaging irregular rocks with dimensions smaller than 19 cm poses a greater challenge for the CE-5 radar system [79]. Additionally, there are issues of clutter and meaningless imaging results in the imaging plots that still need to be resolved.

3.6. Possibility for Solving Cluttered Imaging

Based on the imaging results shown in Figure 8, while the positions of the plastic plate and metal sphere are accurately represented, the irregular rock blocks with a diameter smaller than 19 cm are difficult to locate due to imaging noise and interference. Solving the issue of imaging noise becomes essential when there is a need for precise localization of such objects and a demand for clearer imaging results. Yang et al. [82] proposed a method to handle imaging noise. According to their study, to reduce the noise, they rotated the radar main beam’s transmission direction and imaged it before and after the rotation. By fusing the images obtained before and after the rotation using the Hadamard product, they significantly reduced the noise. The principle is to use strong radar signal data from the main beam transmission for imaging, thereby reducing noise caused by weak signals from the side beams. However, strong radar signals can also cause noise. By rotating the radar main beam’s transmission direction, the trace of strong radar signals differs, and the noise positions in the imaging are different. Since the target positions remain fixed, fusing the two imaging results can eliminate noise from different positions while preserving the target imaging.
The core idea of the method proposed in Yang et al. [82]’s paper is to “multiply” two different radar images with different noise positions to obtain a radar image with reduced noise and containing target information. Based on this idea, we can speculate that to address the imaging noise in LRPR radar, it may be necessary to obtain radar images with the same target positions but different noise positions. Since LRPR radar operates in a static state, and the radar signal transmitter does not rotate, it is not possible to generate images with different noise positions by transmitting signals in different directions. Therefore, to obtain images with consistent target positions without modifying the equipment, it might be necessary to address this issue through data processing and possibly with different imaging algorithms. For the data processing, the experiment’s results of Zhang et al. [12] revealed that the data collected from the Moon exhibits a deviation of approximately 0.850 ns when compared to the data acquired through ground experiments. The calibration of cable delay parameters used is also a crucial step that requires attention [74,75,79]. Based on the position of direct coupling waves and LRPR hardware design, a delay model was developed by Zhang et al. [12] to estimate the cable delay of LRPR, which offers a credible way for calibrating LRPR data and may contribute to reducing cluttered imaging.

4. Radar Observation of the Lunar Regolith’s Interior Structure

4.1. Overview of Drilling and Sampling

Drilling and sampling the shallow subsurface of the moon’s regolith is one of the mission’s key goals of CE-5. The entire drilling process lasted for 39 min, and the layout and specific illustrations of the drilling device are depicted in Figure 7a,b [17]. Figure 7c depicts a drilling scene as captured by a monitoring camera that was positioned at the base of the lander. Notably, the drill core presented in the image possesses an inner diameter of 1.5 cm and an outer diameter of 3.3 cm [13].
During the drilling process, the relevant equipment records real-time data on the drill bit pressure to obtain resistance information of the contact material. Additionally, the drilling system keeps a per-second record of the photoelectric encoder’s rotation angle. Following conversion, this angle information is translated into the depth of the drill bit [23].

4.2. Imaging of Shallow Surface Structure of the Lunar Regolith

The LRPR first conducts an imaging operation before the lander starts the drilling procedure. The imaging result obtained from this operation guides the sampling and drilling process, helping the drill bit avoid damage in rocky areas [23]. Due to the highly challenging profile conditions of the lunar regolith, the entire drilling and coring procedure was halted at an approximate depth of ∼1 m [11,83]. Once the drilling is done, the equipment seals the sample inside the drill core and sends it to the ascender while leaving behind the outer metal drill pipe. Subsequently, the LRPR conducts another local measurement and imaging [17], and these are calculated using the aforementioned imaging algorithm applied to preprocessed radar data, and they are compared with the depth-drill pressure chart (as shown in Figure 9a–c). Figure 9d–f depict the imaging results based on the CE-5 radar by Feng et al. [25]. The only significant difference between the radar imaging findings of Feng et al. [25] and Su et al. [23] is the dynamic range of the pictures they employ.
These radar images, boasting a resolution of around 5 cm, unveiled structures situated approximately 2.5 m beneath the superficial layer of the lunar’s regolith. It is worth noting that these observations were made under the assumption of a relative permittivity of 2.48 for the lunar regolith [23]. However, structures within approximately 20 cm beneath the lunar surface are obscured due to the strong echoes from the area under the lander, preventing accurate imaging. Analyzing the images in Figure 9a,b and considering the depth-drill pressure, it can be observed that before the drill bit reaches a depth of approximately 25 cm, the drill pressure is relatively small (around 112 N), indicating that the drill bit is in a uniform, low-density, and loose lunar regolith area.
After reaching approximately 25 cm, the drill pressure starts to increase sharply and reaches a peak of 345 N at 29 cm. At this point, the radar imaging also shows strong reflections, suggesting a higher density material compared to the surroundings, possibly indicating rock fragments embedded in the lunar regolith. After approximately 40 cm, the drill bit passes through this dense material area, and the drill pressure begins to decrease, and the radar imaging shows lower reflectivity, indicating that the drill bit re-enters a low-density lunar regolith region. At the depth of 75 cm, the drill pressure sharply increases to 437 N, and the strong reflection in the radar imaging suggests that the drill bit has reached a more challenging rock fragment area. Between 75 cm and 80 cm, the drill pressure starts to decrease, and it rises again to 445 N at approximately 88 cm, indicating that the drill bit has passed through two closely spaced rock fragment areas, which corresponds to the strongly reflected layers in the radar imaging (in Figure 9, as shown by the red arrows). At around 100 cm, the drill bit re-enters a low-density lunar regolith area, and the drilling process stops [23].

5. Dielectric Properties of the Lunar Regolith at the Landing Site

5.1. Radar Inversion of Dielectric Permittivity and Loss Tangent

The reflection coefficient at the boundary between the lunar’s regolith and the vacuum can be used to estimate the permittivity ( ε r ) of the regolith of the Moon. The following equation describes the connection between the magnitude of the incident signal and the permittivity ε r [35]:
ε r = A m + A A m A 2
where A m denotes the incident signal’s amplitude, which was measured during ground experiments utilizing a substantial metal plate placed beneath the CE-5 lander prototype, replicating the same conditions as those experienced on the simulated lunar surface. A represents the echo signal’s amplitude as it is reflected off the lunar’s surface. This formula is widely used in the radar-derived relative permittivity of the planetary surface materials [84,85,86]. The estimated relative permittivity and loss tangent of the lunar regolith by the LRPR is shown in Figure 10.
With the obtained dielectric permittivity, the bulk density (in g/cm 3 ) of lunar regolith can be estimated using the following empirical equation obtained from laboratory measurements of the Apollo samples [36]:
ε r = 1 . 919 ρ
The imaginary component of permittivity signifies the medium’s ability to absorb energy from electromagnetic waves, leading to energy loss [87]. To calculate the attenuation caused by losses, adjustments were made to the radar equation to account for the effects of geometric spreading and scattering. When calculating the loss tangent, only the adjacent antennas of the LRPR radar, spaced at 0.12 m, were considered, and the formula is as follows [88]:
tan δ = 1.0989 × 10 7 η f ε r
where η denotes the rate of attenuation which is determined by adjusting the slope of the corrected signal for spreading and backscatter concerning distance. Here, permittivity and central frequency are denoted by ε r and f, respectively.
Figure 10 shows the permittivity estimation of the lunar surface is ∼2.48 and the loss tangent is ∼0.013 [23]. Furthermore, the content of FeO + TiO 2 from the loss tangent can be estimated using the following empirical formula:
tan δ = 10 0.038 ( F e O + T i O 2 ) % + 0.312 ρ 3.26

5.2. Laboratory Measurements of Loss Tangent and Dielectric Permittivity by Lunar Samples

We estimated using the reflection coefficient method and compared it with data obtained from laboratory measurements of the CE-5 samples [23]. The measurement procedure encompassed determining the dielectric permittivity of the lunar surface sample from the CE-5 mission using the coaxial transmission line method. Subsequently, the loss tangent and dielectric permittivity were calculated using an iterative approach using the parameters of scattering [89,90].
The loss tangent and dielectric permittivity of the regolith samples of lunar were estimated using the aforementioned technique, yielding values of ∼0.014 and ∼3.04, respectively, shown in Figure 11. These results align with measurements obtained from Apollo samples [23,36]. The density of the lunar regolith was measured to be 1.58 ± 3 mg/cm 3 based on a sample cage volume of 0.323 cm 3 and a sample weight of 0.51 g ± 0.1 mg. Additionally, the content of TiO 2 and FeO in weight percentage (wt%) was determined using catalytic WD-XRF and AXIOS minerals measurements [23]. The determined content of TiO 2 and FeO in weight percentage was found to be 5.0 ± 0.06% and 22.5 ± 0.33%, which are in line with the previous orbiting observations [23,69].
In conclusion, the real component of the permittivity estimated by the LRPR (∼2.48) is smaller than the value (∼3.04) measured in the laboratory regolith samples. This difference might be attributed to the compaction experienced by samples of lunar regolith during the process of measurement at the laboratory, as indicated by the higher density value recorded (∼1.58 g/cm 3 ) obtained in the laboratory compared to the LRPR radar measurements (∼1.39 g/cm 3 and ∼1.15 g/cm 3 ). The LRPR radar also derives the loss tangent value of ∼0.013 from the attenuation rate of electromagnetic waves in the loss material, which agrees with the laboratory-measured value of ∼0.014. Additionally, utilizing the LRPR radar’s computed loss tangent values, the FeO + TiO 2 content was estimated to be ∼24.7 wt% and ∼26.7 wt%, which is in agreement with the laboratory-measured value of ∼27.5 wt%. Therefore, the LRPR radar-derived loss tangent of the lunar regolith is generally consistent with the laboratory measurements [23].

6. The History of the Lunar Regolith at the Landing Zone

When an impact crater forms, ejecta will be deposited around the crater [91]. The crater’s morphology may typically predict how much ejecta will be produced, while the diameter and distance from the crater’s center typically define how thick the ejecta deposit will be [91]. Generally, the deposit of ejecta is thickest around the crater and decreases outward from the impact crater. According to the model for ejecta deposit thickness proposed by Sharpton [92], one can calculate the contribution of each crater around the CE-5 landing area to the thickness value of ejecta deposit at a certain distance from each crater. The calculated equation can be exhibited as:
T = 0.014 ( ± 0.004 ) R 1.01 r R 3 for simple craters
T = 3.95 ( ± 1.19 ) R 0.399 r R 3 for complex craters
where T represents the thickness of the ejecta, in meters. R stands for the crater’s rim radius and r for the radial distance to the crater’s center. The two equations correspond to simple and complex craters, and the differentiation between these two types of craters is based on their diameters, where craters with diameters smaller than 17 km should use Equation (15). As all craters within 20 km around the CE-5 landing area are much smaller than 17 km, Jai et al. [93] adopted Equation (15) to calculate the ejecta contribution.
The calculation process involves dividing the potential craters contributing to the ejecta deposit in the CE-5 landing area into five ranges from the sampling site [93]: within 1 km, 1–2 km, 2–5 km, 5–10 km, and 10–20 km (as shown in Figure 12). The estimate includes any craters that are visible within the one-kilometer range, while for the other four ranges, the minimum diameter of craters contributing an ejecta thickness of approximately 0.1 mm is used as the cutoff, and craters larger than this diameter are taken into account [93].
In the research conducted by Jia et al. [93], they calculated a total of 1892 craters around the landing area. The results showed that these 1892 craters contributed a thickness of total ejecta deposit of 55.8 cm to the CE-5 landing site. Within 1 km of the landing site, craters contributed 51.7 cm to the ejecta thickness. Furthermore, they identified 12 craters within the 1 km range, with a range of diameters from 61 m to 409 m, which collectively contributed 48 cm to the ejecta deposit thickness. These craters are named C1 to C12 based on their contribution values, with C1 being the crater with the highest contribution and C12 with the lowest (as shown in Figure 12c, and the data can be found in Table 2). Among the 12 craters, the one with the highest contribution value is C1, located at 43.062°N, 51.936°W) and has a diameter of 408.5 m, also known as Xu Guangqi Crater.
The Xu Guangqi crater is approximately 440 m away from the landing site. According to Jia et al. [93], the Xu Guangqi crater is the main source of ejecta at the sample location in the landing region, contributing around 30 cm to the thickness of the ejecta deposit. The crater boasts a depth of approximately 55 m and showcases a smoothly worn rim that has been subject to degradation, with smaller craters overlapping. Notably, two distinct fresh craters near the southern edge stand out as the most prominent features, originating roughly one million years ago [69,94].
The second-largest contribution comes from C2, with a diameter of 104.6 m, contributing about 12 cm to the ejecta deposit thickness. C3 crater contributes only about 1.9 cm [93], and the remaining nine craters have contribution values equal to or less than 1 cm, thus not detailed in the description. If we use Equation (16) to estimate the ejecta layer thickness surrounding the CE-5 landing location, the results may differ significantly from the calculations based on Equation (15), as demonstrated in Qian et al. [94]. In Qian et al. [94]’s study, they selected 736 craters (designated as IC-1 to IC-736, with IC standing for Impact Crater) that potentially contributed to the thickness level of the ejecta layer in the landing region. They arranged the results based on the magnitude of the ejecta contributions (see Table 2). The study also calculated the contributions of ejecta from craters larger than 1 km in diameter. However, even the most significant contribution among these did not surpass the most minor listed contribution, so it needs to be further discussed.
According to their calculations (Qian et al. [94]), the top 12 contributors’ magnitudes are greater than the top 12 contributors in Jia et al. [93]. While both studies share the same top two craters in terms of contribution, the third and subsequent contributors differ. For instance, C3 in Jia et al. [93] corresponds to IC-406 in Qian et al. [94]. Regarding the percentage of contribution, the Xu Guangqi crater had a contribution of 30 cm, accounting for approximately 53.8% of the total (55.8 cm) in the Jia et al. [93]’s study, while C2 had a contribution of 12 cm, approximately 21.5%. In the later study by Qian et al. [94], the Xu Guangqi crater contributed 404.6 cm, accounting for about 36.9% of the total (1096 cm), and IC-265 (corresponding to C2 in Jia et al. [93]’s study) accounted for around 28.5% of the total contributions. Although the two calculation methods yield different magnitudes, the distribution of contributions is roughly similar, which is consistent with the notion that the amount of ejecta produced is influenced by the crater’s size and proximity to the landing region.
Two empirical formulas are employed in studies concerning the ejecta deposition of surface regolith in the landing area. However, there is a disparity in the formulas utilized. Qian et al. [94] utilized Equation (16), while Jia et al. [93] utilized Equation (15). Sharpton [92] mentions that impact craters with diameters smaller than approximately 15–20 km typically exhibit simple bowl-shaped profiles, higher depth-to-diameter ratios, and are characterized by diameter limits of around 17 km based on statistical data and calculations to differentiate between simple and complex impact craters. For these simple craters, the distance from the crater and the crater diameter have a more dominant influence on the estimation of ejecta contributions. Therefore, in comparison to complex craters larger than 17 km, empirical formulas for simple craters provide relatively more reliable estimates. According to images observed by the space-bone mission, the craters surrounding the CE-5 landing area also largely conform to the description of simple craters as outlined in Sharpton [92]. Hence, we lean towards the computational results of Jia et al. [93]. Furthermore, Qian et al. [95] also compiled data on the contributions of ejecta materials from large impact craters (with diameters larger than 17 km) to the deposition in the landing area. It can be observed that, in comparison to small craters, the thickness of ejecta materials from large craters is generally on the order of centimeters (Table 2), and in some cases, it can be negligible.
It is undeniable that factors involved in impact events (such as the incidence angle of the impact, the density of the meteorite, its velocity, and the sequence of impacts) affect the estimation results. However, including too many influencing factors in empirical formulas not only reduces the applicability of the formulas but may also introduce greater errors due to estimation uncertainties of each factor. After all, the use of empirical formulas to calculate ejecta contributions from impact craters is aimed at providing auxiliary explanations for geological stratification in the landing area rather than precise numerical outcomes. This is the reason why we continue to rely on Qian et al. [94]’s interpretations of geological stratification in the landing area, which may have higher associated uncertainties.
Moreover, a comparison between the two calculation processes reveals differences in the selection of impact crater diameters. This disparity may be attributed not only to measurement errors but also to uncertainties in estimating the actual size of the impact craters at the time of formation. The prolonged evolution of impact craters causes their diameters to increase, leading to an overestimation of the ejecta’s contribution due to an overestimation of the crater’s actual diameter. Consequently, the actual diameters of impact craters remain a matter of contention.

7. Geological Stratification and Interpretation of the CE-5 Landing Area

The stratigraphic structure of the shallow subsurface geology may be extrapolated after the thickness of ejecta volumes from several craters in the landing region has been determined. Based on the ejecta contributions calculated by Qian et al. [94], the top five craters ranked in descending order of their contributions are IC-396 (i.e., Xu Guangqi crater), IC-265, IC-266, IC-259, and IC-261, respectively. Starting from the crater morphology classification (A/AB/B/BC/C) proposed by Basilevskii [96] and considering multiple perspectives for estimating crater ages. The stratigraphic structure of the shallow level of subsurface geology in the landing region was analyzed by Qian et al. [94]. Among these craters, Xu Guangqi crater stands out as the primary contributor (Figure 13a). It falls into the B-class crater category with an estimated age ranging from 76 to 492 Ma based on morphological estimation and around 60 Ma years based on degradation processes, resulting in a comprehensive estimate of 60 to 75 Ma. On the other hand, IC-265 (124–248 Ma) and IC-266 (91–182 Ma) exhibit softer morphologies and lack exposed rocks, indicating that they belong to the C-class crater category. As such, their formation likely predates that of the other three craters. In contrast, the formation ages of IC-259 (6–15 Ma) and IC-261 (5–12 Ma), the two smaller craters, are relatively young. They are classified as BC-class craters, and it can be confidently determined that their ejecta is located on the surface of the landing area. With the completion of age estimations for these five craters, Figure 13c displays a schematic diagram of the subsurface geological layers in the landing region.
In Figure 13c, the small diagram on the right presents the process of transitioning from one impact crater source to another as depth increases in the subsurface of the landing area, as shown by Qian et al. [94]. The ejecta mainly originates from IC-261 and IC-259, with a minor contribution from nearby craters at the top. As depth increases, the prevalence of IC-396 ejecta becomes more pronounced, with its dominance evident at a depth of 74 cm. Subsequently, contributions from IC-265 and IC-266 gain significance as we reach a depth of around 4 m. Based on their estimations, the average lunar regolith’s depth of in the landing region is approximately 6.1 m. Blew the lunar surface of 7 m depth, the bedrock should be encountered. It is essential to note that there is a dispute over the numerical aspects of this diagram [93]. According to Jia et al. [93], the total ejecta from craters in the landing area should not exceed 1 m, rather than several meters. Indeed, the CE-5 radar revealed a geological profile at approximately 2.5 m at subsurface depth shown in Figure 13b. Su et al. [23] contend that the radar results did not exhibit distinct stratification. Instead, the material within the shallow lunar regolith (within 2.5 m) consists of fragmented rocks and fine-grained lunar regolith generated from the surrounding impact craters (see Figure 13a). This ejecta likely stems from the crater A and Xu Guangqi crater.
In summary, apart from the shallow surface, the major source of ejecta in the lunar regolith layer of the landing area is Xu Guangqi crater. The secondary source is IC-265/C2/A, which is a consensus among many studies. For the deposition thickness of ejecta materials from impact craters, the discrepancy between different studies lies in the numerical calculations. Therefore, more experiments may be needed to further investigate the impact mechanism of small impact craters and the thickness distribution of statistical ejecta materials deposition.

8. Summary and Future Prospects

The radar data acquired from the CE-5 LRPR represent the highest resolution achieved in lunar radar exploration to date. It revealed the complexity of the interior structure of the shallow regolith of the Moon, challenging the earlier studies that the shallow subsurface was predominantly composed of fine-grained lunar regolith. Instead, it shows that the shallow regolith consists of ejecta from different craters that occurred over time. The CE-5 radar observations covered a depth of ∼2.5 m of the lunar shallow subsurface, and no distinct stratification was observed in the radar images. Both radar observations and laboratory determination measurements of lunar regolith samples have concurred in indicating that the dielectric permittivity of the shallow regolith in the landing area is ∼3.0, which is typical of regolith material. The loss tangent value of ∼0.013 indicated that the lunar regolith in the landing area has a relatively strong capability to absorb electromagnetic waves, suggesting a relatively high FeO + TiO 2 content within the lunar regolith. Due to the unique nature of the CE-5 mission, the array antenna radar carried by its lander is not capable of movement. This limitation results in an extremely limited observation range of the CE-5 radar system. The CE-5 was the first mission to incorporate an array of ground penetrating radar (GPR) for lunar exploration. Therefore, it still holds significant relevance for future lunar exploration endeavors.
Moon-based GPR is of paramount importance and indispensable in future lunar exploration. Notably, upcoming Chinese missions, such as CE-6, CE-7, and CE-8, will all carry GPR systems similar to that of CE-5. Of particular significance, the Chang’E-7 mission is slated to land at the lunar South Pole [97,98], presenting an opportunity to utilize the GPR to detect water ice. Therefore, in addition to probing the shallow lunar regolith structure, we can also anticipate the potential of radar technology in detecting lunar water ice. It may be considered to equip lunar rovers with array antenna radars for future lunar exploration. The CE-3 and CE-4 were equipped with a bistatic ground-penetrating radar, which provided a wealth of observational data and yielded significant research results [40,41,70,99,100,101]. The CE-5 radar’s frequency perfectly complements the absence of higher radar frequency bands in the CE-3 and CE-4 radars, enabling detailed probing of the shallow subsurface structure of the lunar regolith. The primary goal of in-situ radar is to identify the geological stratification of the lunar shallow subsurface and infer dielectric parameter properties of the lunar regolith. Among these characteristics, the dielectric parameter inferences based on radar cannot uniquely determine the evidence of water ice presence. Therefore, there is an urgent need to develop a method and model that can directly detect water ice using in-situ detection radar [102,103]. This is also one of the trends in future in-situ radar exploration on the Moon. The radar payload carried by the CE-3 mission opened a new milestone in ground-penetrating radar technology for planetary surface exploration [40,54,70,104,105,106], after which ground-penetrating radar was successively applied to Mars surface exploration as well [107,108,109,110]. We believe that ground-penetrating radar applications will also be possible for in-situ exploration on other planetary surfaces in the future.

Author Contributions

Conceptualization, C.D.; methodology, F.F. and C.D.; software, F.F. and C.D.; validation, F.F., C.D. and R.S; formal analysis, F.F., C.D., J.F., Y.S., R.S. and I.G.; investigation, F.F., C.D., R.S. and I.G. resources, C.D., J.F. and Y.S.; data curation, F.F. and C.D.; writing—original draft preparation, F.F. and C.D.; writing—review and editing, C.D., J.F., Y.S., R.S. and I.G.; visualization, C.D.; project administration, C.D.; supervision, C.D. All authors have read and agreed to the published version of the manuscript.

Funding

This work is supported by the National Natural Science Foundation of China (Grant No. 42241139 and 42004099), the Opening Fund of the Key Laboratory of Lunar and Deep Space Exploration, Chinese Academy of Sciences (No. LDSE202005), the National Innovation and Entrepreneurship Training Program for College Students (No. 202310590016), the Fund of Shanghai Institute of Aerospace System Engineering (No. PZ_YY_SYF_JY200275), and the Shenzhen Municipal Government Investment Project (No. 2106_440300_04_03_901272).

Acknowledgments

We thank the Ground Application System of Lunar Exploration, NAOC, poviding the data used in CE-5 studies, and the CE-5 radar data has been published on the website and can be freely downloaded through the following website: https://moon.bao.ac.cn/ce5web/moonGisMap.search (accessed on 29 October 2023).

Conflicts of Interest

The authors declare no conflict of interest.

References

  1. Ouyang, Z.; Jiang, J.; Li, C.; Sun, H.; Zou, Y.; Liu, J.; Liu, J.; Zhao, B.; Ren, X.; Yang, J.; et al. Preliminary scientific results of Chang E-1 lunar orbiter: Based on payloads detection data in the first phase. Chin. J. Space Sci. 2008, 28, 361–369. [Google Scholar]
  2. Ouyang, Z.; Li, C.; Zou, Y.; Zhang, H.; Lü, C.; Liu, J.; Liu, J.; Zuo, W.; Su, Y.; Wen, W.; et al. Primary scientific results of Chang’E-1 lunar mission. Sci. China Earth Sci. 2010, 53, 1565–1581. [Google Scholar] [CrossRef]
  3. Li, C.; Liu, J.; Ren, X.; Mou, L.; Zou, Y.; Zhang, H.; Lü, C.; Liu, J.; Zuo, W.; Su, Y.; et al. The global image of the Moon obtained by the Chang’E-1: Data processing and lunar cartography. Sci. China Earth Sci. 2010, 53, 1091–1102. [Google Scholar] [CrossRef]
  4. Ip, W.H.; Yan, J.; Li, C.L.; Ouyang, Z.Y. Preface: The Chang’E-3 lander and rover mission to the Moon. Res. Astron. Astrophys. 2014, 14, 1511. [Google Scholar] [CrossRef]
  5. Li, C.; Liu, J.; Ren, X.; Zuo, W.; Tan, X.; Wen, W.; Li, H.; Mu, L.; Su, Y.; Zhang, H.; et al. The Chang’e 3 mission overview. Space Sci. Rev. 2015, 190, 85–101. [Google Scholar] [CrossRef]
  6. Ding, C.; Feng, J.; Zheng, L.; Dai, S.; Xing, S.; Xiao, Y.; Su, Y. A review of applications of radar-detection techniques in lunar explorations. Astron. Res. Technol. Publ. Natl. Astron. Obs. China 2015, 12, 228–242. [Google Scholar]
  7. Li, C.; Su, Y.; Pettinelli, E.; Xing, S.; Ding, C.; Liu, J.; Ren, X.; Lauro, S.E.; Soldovieri, F.; Zeng, X.; et al. The Moon’s farside shallow subsurface structure unveiled by Chang’E-4 Lunar Penetrating Radar. Sci. Adv. 2020, 6, eaay6898. [Google Scholar] [CrossRef]
  8. Zheng, Y.; Ouyang, Z.; Li, C.; Liu, J.; Zou, Y. China’s lunar exploration program: Present and future. Planet. Space Sci. 2008, 56, 881–886. [Google Scholar] [CrossRef]
  9. Xu, L.; Ouyang, Z. Scientific progress in China’s lunar exploration program. Chin. J. Space Sci. 2014, 34, 525–534. [Google Scholar] [CrossRef]
  10. Li, C.; Wang, C.; Wei, Y.; Lin, Y. China’s present and future lunar exploration program. Science 2019, 365, 238–239. [Google Scholar] [CrossRef]
  11. Ding, C.; Su, Y.; Lei, Z.; Zhang, Z.; Song, M.; Liu, Y.; Wang, R.; Li, Q.; Li, C.; Huang, S. Electromagnetic Signal Attenuation Characteristics in the Lunar Regolith Observed by the Lunar Regolith Penetrating Radar (LRPR) Onboard the Chang’E-5 Lander. Remote Sens. 2022, 14, 5189. [Google Scholar] [CrossRef]
  12. Zhang, Z.; Su, Y.; Dai, S.; Zhou, J.; Ren, X.; Liu, J.; Li, C. Revealing regolith substructure by Chang’E-5 LRPR with optimized cable delay calibration method. Icarus 2023, 402, 115630. [Google Scholar] [CrossRef]
  13. Li, Y.; Zhou, B.; Shen, S.; Lu, W.; Tang, C.; Li, S.; Su, Y.; Dai, S.; Fang, G. The Lunar Regolith Structure and Electromagnetic Properties of Chang’E-5 Landing Site. Remote Sens. 2022, 14, 4539. [Google Scholar] [CrossRef]
  14. Jia, B.; Fa, W.; Xie, M.; Tai, Y.; Liu, X. Regolith Properties in the Chang’E-5 Landing Region of the Moon: Results From Multi-Source Remote Sensing Observations. J. Geophys. Res. Planets 2021, 126, e2021JE006934. [Google Scholar] [CrossRef]
  15. Yang, M.; Zhang, G.; Zhang, W.; Peng, J.; Ruan, J.; Wang, Y.; Zhang, H.; Hong, X.; Zhang, Y.; Zha, X.; et al. Technical design and implementation of Chang’e-5 robotic sample return mission on lunar surface. Sci. China Technol. Sci. 2021, 51, 738–752. [Google Scholar]
  16. Zhou, C.; Jia, Y.; Liu, J.; Li, H.; Fan, Y.; Zhang, Z.; Liu, Y.; Jiang, Y.; Zhou, B.; He, Z.; et al. Scientific objectives and payloads of the lunar sample return mission—Chang’E-5. Adv. Space Res. 2022, 69, 823–836. [Google Scholar] [CrossRef]
  17. Zheng, Y.; Yang, M.; Deng, X.; Jin, S.; Peng, J.; Su, Y.; Gu, Z.; Chen, L.; Pang, Y.; Zhang, N. Analysis of Chang’e-5 lunar core drilling process. Chin. J. Aeronaut. 2023, 36, 292–303. [Google Scholar] [CrossRef]
  18. Tian, H.C.; Wang, H.; Chen, Y.; Yang, W.; Zhou, Q.; Zhang, C.; Lin, H.L.; Huang, C.; Wu, S.T.; Jia, L.H.; et al. Non-KREEP origin for Chang’e-5 basalts in the Procellarum KREEP Terrane. Nature 2021, 600, 59–63. [Google Scholar] [CrossRef]
  19. Hu, S.; He, H.; Ji, J.; Lin, Y.; Hui, H.; Anand, M.; Tartèse, R.; Yan, Y.; Hao, J.; Li, R.; et al. A dry lunar mantle reservoir for young mare basalts of Chang’e-5. Nature 2021, 600, 49–53. [Google Scholar] [CrossRef]
  20. Yao, Y.; Xiao, C.; Wang, P.; Li, C.; Zhou, Q. Instrumental neutron activation analysis of Chang’E-5 lunar regolith samples. J. Am. Chem. Soc. 2022, 144, 5478–5484. [Google Scholar] [CrossRef]
  21. Zhang, H.; Zhang, X.; Zhang, G.; Dong, K.; Deng, X.; Gao, X.; Yang, Y.; Xiao, Y.; Bai, X.; Liang, K.; et al. Size, morphology, and composition of lunar samples returned by Chang’E-5 mission. Sci. China Phys. Mech. Astron. 2022, 65, 229511. [Google Scholar] [CrossRef]
  22. Zong, K.; Wang, Z.; Li, J.; He, Q.; Li, Y.; Becker, H.; Zhang, W.; Hu, Z.; He, T.; Cao, K.; et al. Bulk compositions of the Chang’E-5 lunar soil: Insights into chemical homogeneity, exotic addition, and origin of landing site basalts. Geochim. Cosmochim. Acta 2022, 335, 284–296. [Google Scholar] [CrossRef]
  23. Su, Y.; Wang, R.; Deng, X.; Zhang, Z.; Zhou, J.; Xiao, Z.; Ding, C.; Li, Y.; Dai, S.; Ren, X.; et al. Hyperfine structure of regolith unveiled by Chang’E-5 lunar regolith penetrating radar. IEEE Trans. Geosci. Remote Sens. 2022, 60, 5110414. [Google Scholar] [CrossRef]
  24. Wang, R.; Su, Y.; Ding, C.; Dai, S.; Liu, C.; Zhang, Z.; Hong, T.; Zhang, Q.; Li, C. A novel approach for permittivity estimation of lunar regolith using the lunar penetrating radar onboard Chang’E-4 rover. Remote Sens. 2021, 13, 3679. [Google Scholar] [CrossRef]
  25. Feng, J.; Siegler, M.A.; White, M.N. Shallow regolith structure and obstructions detected by lunar regolith penetrating radar at Chang’E-5 drilling site. Remote Sens. 2022, 14, 3378. [Google Scholar] [CrossRef]
  26. Liu, Y.; Wang, T.; Jia, Y.; Song, M.; Ding, C.; Huang, S. Thermal environment of the Chang’E-5 landing site and its effect on the external temperature of the lander. Sci. Sin. Phys. Mech. Astron. 2023, 53, 239608. [Google Scholar] [CrossRef]
  27. Li, J.; Bai, L.; Liu, H. Numerical verification of full waveform inversion for the Chang’E-5 lunar regolith penetrating array radar. IEEE Trans. Geosci. Remote Sens. 2021, 60, 5903710. [Google Scholar] [CrossRef]
  28. Li, C.; Hu, H.; Yang, M.F.; Pei, Z.Y.; Zhou, Q.; Ren, X.; Liu, B.; Liu, D.; Zeng, X.; Zhang, G.; et al. Characteristics of the lunar samples returned by the Chang’E-5 mission. Natl. Sci. Rev. 2022, 9, nwab188. [Google Scholar] [CrossRef]
  29. Song, M.; Zhong, Y.; Ding, C.; Liu, Y.; Huang, S.; Li, Q. Regolith mineral detection and abundance estimation based on the LMS spectral data of Chang’E-5 lander. Sci. Sin. Phys. Mech. Astron. 2023, 53, 239607. [Google Scholar] [CrossRef]
  30. Nie, J.; Cui, Y.; Senetakis, K.; Guo, D.; Wang, Y.; Wang, G.; Feng, P.; He, H.; Zhang, X.; Zhang, X.; et al. Predicting residual friction angle of lunar regolith based on Chang’e-5 lunar samples. Sci. Bull. 2023, 68, 730–739. [Google Scholar] [CrossRef] [PubMed]
  31. Zhao, R.; Shen, L.; Xiao, D.; Chang, C.; Huang, Y.; Yu, J.; Zhang, H.; Liu, M.; Zhao, S.; Yao, W.; et al. Diverse glasses revealed from Chang’E-5 lunar regolith. Natl. Sci. Rev. 2023, 10, nwad079. [Google Scholar] [CrossRef]
  32. Zeng, X.; Li, X.; Liu, J. Exotic clasts in Chang’e-5 regolith indicative of unexplored terrane on the Moon. Nat. Astron. 2023, 7, 152–159. [Google Scholar] [CrossRef]
  33. Tian, H.C.; Zhang, C.; Yang, W.; Du, J.; Chen, Y.; Xiao, Z.; Mitchell, R.N.; Hui, H.; Changela, H.G.; Zhang, T.X.; et al. Surges in volcanic activity on the Moon about two billion years ago. Nat. Commun. 2023, 14, 3734. [Google Scholar] [CrossRef] [PubMed]
  34. Xiao, Y.; Su, Y.; Dai, S.; Feng, J.; Xing, S.; Ding, C.; Li, C. Ground experiments of Chang’e-5 lunar regolith penetrating radar. Adv. Space Res. 2019, 63, 3404–3419. [Google Scholar] [CrossRef]
  35. Li, Y.; Lu, W.; Fang, G.; Zhou, B.; Shen, S. Performance verification of lunar regolith penetrating array radar of Chang’E-5 mission. Adv. Space Res. 2019, 63, 2267–2278. [Google Scholar] [CrossRef]
  36. Carrier, W.D., III; Olhoeft, G.R.; Mendell, W. Physical properties of the lunar surface. In Lunar Sourcebook, a User’s Guide to the Moon; Cambridge University Press: Cambridge, UK, 1991; pp. 475–594. [Google Scholar]
  37. Shkuratov, Y.G.; Bondarenko, N.V. Regolith layer thickness mapping of the Moon by radar and optical data. Icarus 2001, 149, 329–338. [Google Scholar] [CrossRef]
  38. Fa, W.; Wieczorek, M.A. Regolith thickness over the lunar nearside: Results from Earth-based 70-cm Arecibo radar observations. Icarus 2012, 218, 771–787. [Google Scholar] [CrossRef]
  39. Slyuta, E. Physical and mechanical properties of the lunar soil (A review). Sol. Syst. Res. 2014, 48, 330–353. [Google Scholar] [CrossRef]
  40. Xiao, L.; Zhu, P.; Fang, G.; Xiao, Z.; Zou, Y.; Zhao, J.; Zhao, N.; Yuan, Y.; Qiao, L.; Zhang, X.; et al. A young multilayered terrane of the northern Mare Imbrium revealed by Chang’E-3 mission. Science 2015, 347, 1226–1229. [Google Scholar] [CrossRef]
  41. Feng, J.; Su, Y.; Ding, C.; Xing, S.; Dai, S.; Zou, Y. Dielectric properties estimation of the lunar regolith at CE-3 landing site using lunar penetrating radar data. Icarus 2017, 284, 424–430. [Google Scholar] [CrossRef]
  42. Ding, C.; Li, C.; Xiao, Z.; Su, Y.; Xing, S.; Wang, Y.; Feng, J.; Dai, S.; Xiao, Y.; Yao, M. Layering structures in the porous material beneath the Chang’e-3 landing site. Earth Space Sci. 2020, 7, e2019EA000862. [Google Scholar] [CrossRef]
  43. Xiao, Z.; Ding, C.; Xie, M.; Cai, Y.; Cui, J.; Zhang, K.; Wang, J. Ejecta from the Orientale basin at the Chang’E-4 landing site. Geophys. Res. Lett. 2021, 48, e2020GL090935. [Google Scholar] [CrossRef]
  44. Colwell, J.; Batiste, S.; Horányi, M.; Robertson, S.; Sture, S. Lunar surface: Dust dynamics and regolith mechanics. Rev. Geophys. 2007, 45, RG2006. [Google Scholar] [CrossRef]
  45. Peeples, W.J.; Sill, W.R.; May, T.W.; Ward, S.H.; Phillips, R.J.; Jordan, R.L.; Abbott, E.A.; Killpack, T.J. Orbital radar evidence for lunar subsurface layering in Maria Serenitatis and Crisium. J. Geophys. Res. Solid Earth 1978, 83, 3459–3468. [Google Scholar] [CrossRef]
  46. Honglei, L.; Chunyu, D.; Xuesen, X.; Jinhai, Z.; Yong, W.; Yangting, L. Review on the in-situ spectroscopy and radar remote sensing on the Moon. Rev. Geophys. Planet. Phys. 2021, 52, 373–390. [Google Scholar]
  47. Taylor, G.; Warner, R.; Keil, K. Stratigraphy and depositional history of the Apollo 17 drill core. In Proceedings of the 10th Lunar and Planetary Science Conference, Houston, TX, USA, 19–23 March 1979; Pergamon Press, Inc.: New York, NY, USA, 1979; Volume 2, pp. 1159–1184. [Google Scholar]
  48. Morris, R.; Lauer, H., Jr.; Gose, W. Characterization and depositional and evolutionary history of the Apollo 17 deep drill core. In Proceedings of the 10th Lunar and Planetary Science Conference, Houston, TX, USA, 19–23 March 1979; Pergamon Press, Inc.: New York, NY, USA, 1979; Volume 2, pp. 1141–1157. [Google Scholar]
  49. Bar-Cohen, Y.; Zacny, K. Drilling in Extreme Environments: Penetration and Sampling on Earth and Other Planets; John Wiley & Sons: Hoboken, NJ, USA, 2009. [Google Scholar]
  50. Renner, K. Apollo 17: Preliminary Science Report; National Aeronautics and Space Administration: Washington, DC, USA, 1973.
  51. Su, Y.; Fang, G.Y.; Feng, J.Q.; Xing, S.G.; Ji, Y.C.; Zhou, B.; Gao, Y.Z.; Li, H.; Dai, S.; Xiao, Y.; et al. Data processing and initial results of Chang’e-3 lunar penetrating radar. Res. Astron. Astrophys. 2014, 14, 1623. [Google Scholar] [CrossRef]
  52. Lai, J.; Xu, Y.; Zhang, X.; Xiao, L.; Yan, Q.; Meng, X.; Zhou, B.; Dong, Z.; Zhao, D. Comparison of dielectric properties and structure of lunar regolith at Chang’e-3 and Chang’e-4 landing sites revealed by ground-penetrating radar. Geophys. Res. Lett. 2019, 46, 12783–12793. [Google Scholar] [CrossRef]
  53. Ding, C.; Xiao, Z.; Su, Y.; Zhao, J.; Cui, J. Compositional variations along the route of Chang’e-3 Yutu rover revealed by the lunar penetrating radar. Prog. Earth Planet. Sci. 2020, 7, 32. [Google Scholar] [CrossRef]
  54. Fang, G.Y.; Zhou, B.; Ji, Y.C.; Zhang, Q.Y.; Shen, S.X.; Li, Y.X.; Guan, H.F.; Tang, C.J.; Gao, Y.Z.; Lu, W.; et al. Lunar Penetrating Radar onboard the Chang’e-3 mission. Res. Astron. Astrophys. 2014, 14, 1607. [Google Scholar] [CrossRef]
  55. Shen, S.; Zhou, B.; Li, Y.; Lu, W.; Liu, Q.; Tang, C.; Fang, G.; Wang, L. The design of payload lunar regolith penetrating radar on chang’e-5 lander. IEEE Aerosp. Electron. Syst. Mag. 2021, 36, 4–16. [Google Scholar] [CrossRef]
  56. Qian, Y.; Xiao, L.; Head, J.W.; van der Bogert, C.H.; Hiesinger, H.; Wilson, L. Young lunar mare basalts in the Chang’e-5 sample return region, northern Oceanus Procellarum. Earth Planet. Sci. Lett. 2021, 555, 116702. [Google Scholar] [CrossRef]
  57. Wang, J.; Zhang, Y.; Di, K.; Chen, M.; Duan, J.; Kong, J.; Xie, J.; Liu, Z.; Wan, W.; Rong, Z.; et al. Localization of the Chang’e-5 lander using radio-tracking and image-based methods. Remote Sens. 2021, 13, 590. [Google Scholar] [CrossRef]
  58. Hiesinger, H.; Head, J., III; Wolf, U.; Jaumann, R.; Neukum, G. Ages and stratigraphy of mare basalts in oceanus procellarum, mare nubium, mare cognitum, and mare insularum. J. Geophys. Res. Planets 2003, 108, E7. [Google Scholar] [CrossRef]
  59. Liu, J.; Zeng, X.; Li, C.; Ren, X.; Yan, W.; Tan, X.; Zhang, X.; Chen, W.; Zuo, W.; Liu, Y.; et al. Landing site selection and overview of China’s lunar landing missions. Space Sci. Rev. 2021, 217, 1–25. [Google Scholar] [CrossRef]
  60. Wu, B.; Huang, J.; Li, Y.; Wang, Y.; Peng, J. Rock abundance and crater density in the candidate Chang’E-5 landing region on the Moon. J. Geophys. Res. Planets 2018, 123, 3256–3272. [Google Scholar] [CrossRef]
  61. Morota, T.; Haruyama, J.; Ohtake, M.; Matsunaga, T.; Honda, C.; Yokota, Y.; Kimura, J.; Ogawa, Y.; Hirata, N.; Demura, H.; et al. Timing and characteristics of the latest mare eruption on the Moon. Earth Planet. Sci. Lett. 2011, 302, 255–266. [Google Scholar] [CrossRef]
  62. Boyce, J.M. Ages of flow units in the lunar nearside maria based on Lunar Orbiter IV photographs. In Proceedings of the 7th Lunar Science Conference, Houston, TX, USA, 15–19 March 1976; Pergamon Press, Inc.: New York, NY, USA, 1976; Volume 3, pp. 2717–2728. [Google Scholar]
  63. Jia, M.; Yue, Z.; Di, K.; Liu, B.; Liu, J.; Michael, G. A catalogue of impact craters larger than 200 m and surface age analysis in the Chang’e-5 landing area. Earth Planet. Sci. Lett. 2020, 541, 116272. [Google Scholar] [CrossRef]
  64. Qian, Y.; Xiao, L.; Zhao, S.; Zhao, J.; Huang, J.; Flahaut, J.; Martinot, M.; Head, J.; Hiesinger, H.; Wang, G. Geology and scientific significance of the Rümker region in northern Oceanus Procellarum: China’s Chang’E-5 landing region. J. Geophys. Res. Planets 2018, 123, 1407–1430. [Google Scholar] [CrossRef]
  65. Che, X.; Nemchin, A.; Liu, D.; Long, T.; Wang, C.; Norman, M.D.; Joy, K.H.; Tartese, R.; Head, J.; Jolliff, B.; et al. Age and composition of young basalts on the Moon, measured from samples returned by Chang’e-5. Science 2021, 374, 887–890. [Google Scholar] [CrossRef]
  66. Li, Q.L.; Zhou, Q.; Liu, Y.; Xiao, Z.; Lin, Y.; Li, J.H.; Ma, H.X.; Tang, G.Q.; Guo, S.; Tang, X.; et al. Two-billion-year-old volcanism on the Moon from Chang’e-5 basalts. Nature 2021, 600, 54–58. [Google Scholar] [CrossRef]
  67. Zhao, J.; Xiao, L.; Qiao, L.; Glotch, T.D.; Huang, Q. The Mons Rümker volcanic complex of the Moon: A candidate landing site for the Chang’E-5 mission. J. Geophys. Res. Planets 2017, 122, 1419–1442. [Google Scholar] [CrossRef]
  68. Hurwitz, D.M.; Head, J.W.; Hiesinger, H. Lunar sinuous rilles: Distribution, characteristics, and implications for their origin. Planet. Space Sci. 2013, 79, 1–38. [Google Scholar] [CrossRef]
  69. Qiao, L.; Chen, J.; Xu, L.; Wan, S.; Cao, H.; Li, B.; Ling, Z. Geology of the Chang’e-5 landing site: Constraints on the sources of samples returned from a young nearside mare. Icarus 2021, 364, 114480. [Google Scholar] [CrossRef]
  70. Zhang, J.; Yang, W.; Hu, S.; Lin, Y.; Fang, G.; Li, C.; Peng, W.; Zhu, S.; He, Z.; Zhou, B.; et al. Volcanic history of the Imbrium basin: A close-up view from the lunar rover Yutu. Proc. Natl. Acad. Sci. USA 2015, 112, 5342–5347. [Google Scholar] [CrossRef]
  71. Ling, Z.; Jolliff, B.L.; Wang, A.; Li, C.; Liu, J.; Zhang, J.; Li, B.; Sun, L.; Chen, J.; Xiao, L.; et al. Correlated compositional and mineralogical investigations at the Chang’ e-3 landing site. Nat. Commun. 2015, 6, 8880. [Google Scholar] [CrossRef]
  72. Tronca, G.; Tsalicoalou, I.; Lehner, S.; Catanzariti, G. Comparison of pulsed and stepped frequency continuous wave (SFCW) GPR systems. In Proceedings of the 2018 17th International Conference on Ground Penetrating Radar (GPR), Rapperswil, Switzerland, 18–21 June 2018; pp. 1–4. [Google Scholar] [CrossRef]
  73. Leckebusch, J. Comparison of a stepped-frequency continuous wave and a pulsed GPR system. Archaeol. Prospect. 2011, 18, 15–25. [Google Scholar] [CrossRef]
  74. Li, Y.; Fang, G.; Ji, Y.; Zhou, B.; Shen, S. Data processing and some results of Chang’E-5 LRPR ground verification. In Proceedings of the 2016 16th International Conference on Ground Penetrating Radar (GPR), Hong Kong, China, 13–16 June 2016; pp. 1–4. [Google Scholar]
  75. Li, Y.; Lu, W.; Fang, G.; Shen, S. The imaging method and verification experiment of Chang’E-5 lunar regolith penetrating array radar. IEEE Geosci. Remote Sens. Lett. 2018, 15, 1006–1010. [Google Scholar] [CrossRef]
  76. Li, C.; Zuo, W.; Wen, W.; Zeng, X.; Gao, X.; Liu, Y.; Fu, Q.; Zhang, Z.; Su, Y.; Ren, X.; et al. Overview of the Chang’e-4 mission: Opening the frontier of scientific exploration of the lunar far side. Space Sci. Rev. 2021, 217, 1–32. [Google Scholar] [CrossRef]
  77. Feng, J.; Siegler, M.A.; White, M.N. Dielectric properties and stratigraphy of regolith in the lunar South Pole-Aitken basin: Observations from the Lunar Penetrating Radar. Astron. Astrophys. 2022, 661, A47. [Google Scholar] [CrossRef]
  78. Zhang, H.B.; Zheng, L.; Su, Y.; Fang, G.Y.; Zhou, B.; Feng, J.Q.; Xing, S.G.; Dai, S.; Li, J.D.; Ji, Y.C.; et al. Performance evaluation of lunar penetrating radar onboard the rover of CE-3 probe based on results from ground experiments. Res. Astron. Astrophys. 2014, 14, 1633. [Google Scholar] [CrossRef]
  79. Feng, J.; Su, Y.; Li, C.; Dai, S.; Xing, S.; Xiao, Y. An imaging method for Chang’e- 5 Lunar Regolith Penetrating Radar. Planet. Space Sci. 2019, 167, 9–16. [Google Scholar] [CrossRef]
  80. Liu, H.; Takahashi, K.; Sato, M. Measurement of dielectric permittivity and thickness of snow and ice on a brackish lagoon using GPR. IEEE J. Sel. Top. Appl. Earth Obs. Remote Sens. 2013, 7, 820–827. [Google Scholar] [CrossRef]
  81. Dix, C.H. Seismic velocities from surface measurements. Geophysics 1955, 20, 68–86. [Google Scholar] [CrossRef]
  82. Yang, Y.; Chen, C.; Jia, Y.; Cui, G.; Guo, S. Non-line-of-sight target detection based on dual-view observation with single-channel uwb radar. Remote Sens. 2022, 14, 4532. [Google Scholar] [CrossRef]
  83. Liang, J.; Tao, L.; Zhang, W.; Tang, J.; Pang, Y.; Jiang, S. Analysis of the lunar regolith sample obstruction in the Chang’E-5 drill and its improvement. Adv. Space Res. 2022, 69, 2248–2258. [Google Scholar] [CrossRef]
  84. Dong, Z.; Fang, G.; Ji, Y.; Gao, Y.; Wu, C.; Zhang, X. Parameters and structure of lunar regolith in Chang’E-3 landing area from lunar penetrating radar (LPR) data. Icarus 2017, 282, 40–46. [Google Scholar] [CrossRef]
  85. Ding, C.; Xiao, Z.; Wu, B.; Li, Z.; Su, Y.; Zhou, B.; Liu, K.; Cui, J. Rock Fragments in Shallow Lunar Regolith: Constraints by the Lunar Penetrating Radar Onboard the Chang’E-4 Mission. J. Geophys. Res. Planets 2021, 126, e2021JE006917. [Google Scholar] [CrossRef]
  86. Herve, Y.; Ciarletti, V.; Le Gall, A.; Corbel, C.; Hassen-Khodja, R.; Benedix, W.; Plettemeier, D.; Humeau, O.; Vieau, A.J.; Lustrement, B.; et al. The WISDOM radar on board the ExoMars 2022 Rover: Characterization and calibration of the flight model. Planet. Space Sci. 2020, 189, 104939. [Google Scholar] [CrossRef]
  87. Long, D.; Ulaby, F. Microwave Radar and Radiometric Remote Sensing; Artech: Norwood, MA, USA, 2015. [Google Scholar]
  88. Grimm, R.E.; Heggy, E.; Clifford, S.; Dinwiddie, C.; McGinnis, R.; Farrell, D. Absorption and scattering in ground-penetrating radar: Analysis of the Bishop Tuff. J. Geophys. Res. Planets 2006, 111, E6. [Google Scholar] [CrossRef]
  89. ASTM D5568-08; Standard Test Method for Measuring Relative Complex Permittivity and Relative Magnetic Permeability of Solid Materials at Microwave Frequencies. ASTM International: West Conshohocken, PA, USA, 2022; Volume 10.
  90. Baker-Jarvis, J.; Janezic, M.D.; Grosvenor, J.H., Jr.; Geyer, R.G. Transmission/reflection and short-circuit line methods for measuring permittivity and permeability. NASA STI/Recon. Tech. Rep. N 1992, 93, 12084. [Google Scholar]
  91. Melosh, H.J. Impact Cratering: A Geologic Process; Oxford University Press: New York, NY, USA; Clarendon Press: Oxford, UK, 1989. [Google Scholar]
  92. Sharpton, V.L. Outcrops on lunar crater rims: Implications for rim construction mechanisms, ejecta volumes and excavation depths. J. Geophys. Res. Planets 2014, 119, 154–168. [Google Scholar] [CrossRef]
  93. Jia, B.; Fa, W.; Zhang, M.; Di, K.; Xie, M.; Tai, Y.; Li, Y. On the provenance of the Chang’E-5 lunar samples. Earth Planet. Sci. Lett. 2022, 596, 117791. [Google Scholar] [CrossRef]
  94. Qian, Y.; Xiao, L.; Head, J.W.; Wöhler, C.; Bugiolacchi, R.; Wilhelm, T.; Althoff, S.; Ye, B.; He, Q.; Yuan, Y.; et al. Copernican-aged (<200 Ma) impact ejecta at the Chang’e-5 landing site: Statistical evidence from crater morphology, morphometry, and degradation models. Geophys. Res. Lett. 2021, 48, e2021GL095341. [Google Scholar]
  95. Qian, Y.; Xiao, L.; Wang, Q.; Head, J.W.; Yang, R.; Kang, Y.; van der Bogert, C.H.; Hiesinger, H.; Lai, X.; Wang, G.; et al. China’s Chang’e-5 landing site: Geology, stratigraphy, and provenance of materials. Earth Planet. Sci. Lett. 2021, 561, 116855. [Google Scholar] [CrossRef]
  96. Basilevskii, A. On the evolution rate of small lunar craters. In Proceedings of the 7th Lunar Science Conference, Houston, TX, USA, 15–19 March 1976; Pergamon Press, Inc.: New York, NY, USA, 1976; Volume 1, pp. 1005–1020. [Google Scholar]
  97. Zou, Y.; Liu, Y.; Jia, Y. Overview of China’s Upcoming Chang’E Series and the Scientific Objectives and Payloads for Chang’E 7 Mission. In Proceedings of the 51st Annual Lunar and Planetary Science Conference, Woodlands, TX, USA, 16–20 March 2020; Volume 2326, p. 1755. [Google Scholar]
  98. Jia, Y.; Zhang, Z.; Qin, L.; Ma, T.; Lv, B.; Fu, Z.; Xue, C.; Zou, Y. Research of Lunar Water-Ice and Exploration for China’s Future Lunar Water-Ice Exploration. Space Sci. Technol. 2023, 3, 0026. [Google Scholar] [CrossRef]
  99. Ding, C.; Cai, Y.; Xiao, Z.; Su, Y. A rocky hill on the continuous ejecta of Ziwei crater revealed by the Chang’e-3 mission. Earth Planet. Phys. 2020, 4, 105–110. [Google Scholar] [CrossRef]
  100. Ding, C.; Xiao, Z.; Su, Y. A potential subsurface cavity in the continuous ejecta deposits of the Ziwei crater discovered by the Chang’E-3 mission. Earth Planets Space 2021, 73, 53. [Google Scholar] [CrossRef]
  101. Zhou, H.; Feng, X.; Ding, C.; Dong, Z.; Liu, C.; Liang, W. Heterogeneous Weathering Process of Lunar Regolith Revealed by Polarimetric Attributes Analysis of Chang’E-4 Lunar Penetrating Radar Data Acquired During the Yutu-2 Turnings. Geophys. Res. Lett. 2022, 49, e2022GL099207. [Google Scholar] [CrossRef]
  102. Lin, H.; Li, S.; Xu, R.; Liu, Y.; Wu, X.; Yang, W.; Wei, Y.; Lin, Y.; He, Z.; Hui, H.; et al. In situ detection of water on the Moon by the Chang’E-5 lander. Sci. Adv. 2022, 8, eabl9174. [Google Scholar] [CrossRef]
  103. Liu, J.; Liu, B.; Ren, X.; Li, C.; Shu, R.; Guo, L.; Yu, S.; Zhou, Q.; Liu, D.; Zeng, X.; et al. Evidence of water on the lunar surface from Chang’E-5 in-situ spectra and returned samples. Nat. Commun. 2022, 13, 3119. [Google Scholar] [CrossRef]
  104. Xing, S.G.; Su, Y.; Feng, J.Q.; Dai, S.; Xiao, Y.; Ding, C.Y.; Li, C.L. The penetrating depth analysis of Lunar Penetrating Radar onboard Chang’e-3 rover. Res. Astron. Astrophys. 2017, 17, 046. [Google Scholar] [CrossRef]
  105. Ding, C.; Xiao, Z.; Wu, B.; Li, Y.; Prieur, N.C.; Cai, Y.; Su, Y.; Cui, J. Fragments delivered by secondary craters at the Chang’E-4 landing site. Geophys. Res. Lett. 2020, 47, e2020GL087361. [Google Scholar] [CrossRef]
  106. Ding, C.; Li, J.; Hu, R. Moon-based Ground Penetrating Radar Observation of the Latest Volcanic Activity at the Chang’E-4 Landing Site. IEEE Trans. Geosci. Remote. Sens. 2023, 61, 4600410. [Google Scholar] [CrossRef]
  107. Qiu, X.; Ding, C. Radar Observation of the Lava Tubes on the Moon and Mars. Remote Sens. 2023, 15, 2850. [Google Scholar] [CrossRef]
  108. Ciarletti, V.; Clifford, S.; Plettemeier, D.; Le Gall, A.; Hervé, Y.; Dorizon, S.; Quantin-Nataf, C.; Benedix, W.S.; Schwenzer, S.; Pettinelli, E.; et al. The WISDOM radar: Unveiling the subsurface beneath the ExoMars Rover and identifying the best locations for drilling. Astrobiology 2017, 17, 565–584. [Google Scholar] [CrossRef]
  109. Hamran, S.E.; Paige, D.A.; Allwood, A.; Amundsen, H.E.; Berger, T.; Brovoll, S.; Carter, L.; Casademont, T.M.; Damsgård, L.; Dypvik, H.; et al. Ground penetrating radar observations of subsurface structures in the floor of Jezero crater, Mars. Sci. Adv. 2022, 8, eabp8564. [Google Scholar] [CrossRef]
  110. Chen, R.; Zhang, L.; Xu, Y.; Liu, R.; Bugiolacchi, R.; Zhang, X.; Chen, L.; Zeng, Z.; Liu, C. Martian soil as revealed by ground-penetrating radar at the Tianwen-1 landing site. Geology 2023, 51, 315–319. [Google Scholar] [CrossRef]
Figure 1. The morphological context of the CE-5 landing site (adopted from Li et al. [13]), and CLEP stands for China’s Lunar Exploration Project. (a) The comprehensive geological information was obtained through the Digital Orthophoto Map (DOM) from CE-2, and the position of the CE-5 lander is indicated by a red cross. (b) The Landing camera of CE-5 provided the image of the landing location, and the CE-5 lander is inside the white box. (c) Topographic map captured by panoramic camera of the CE-5.
Remotesensing 15 05173 g001
Figure 2. FeO (a) and TiO 2 (b) concentration distribution maps in the CE-5 landing location, adopted from Qiao et al. [69].
Remotesensing 15 05173 g002
Figure 3. Layout diagram of LRPR radar antenna array, adopted form Ding et al. [11]. The inset image in the lower left corner represents the antennas’ position, with the typical spacing between antennas being 12 cm.
Remotesensing 15 05173 g003
Figure 4. Experimental site and conditions for ground verification of CE-5 LRPR (modified from Xiao et al. [34], Li et al. [35]). (a) The LRPR carried by the lander model. (b) The structure of the test site. (c) Targets excavation. (d) The LRPR deployed on the lunar regolith simulant. (e) The location of the buried targets within the lunar regolith simulant.
Remotesensing 15 05173 g004
Figure 5. Radar images acquired from the ground experiments, adopted from Feng et al. [79]. (a) Raw radargram. (b) Processed radargram after applying delay correction, bandpass filtering, and sampling calibration. (c) Radargram after background removal.
Remotesensing 15 05173 g005
Figure 6. Estimation of velocity spectrum for LRPR data (adopted from Feng et al. [79]). (a) Envelope velocity spectrum. (b) The geometric path of electromagnetic wave propagation in two media.
Remotesensing 15 05173 g006
Figure 7. Core sampling scene of the CE-5 mission on the Moon’s surface (adopted from Zheng et al. [17]. (a) Layout of drilling equipment. (b) Schematic diagram of drilling mechanism. (c) Drilling Scenario.
Remotesensing 15 05173 g007
Figure 8. Radar imaging results of CE-5 ground experiment [79], in which the arrows indicate areas with clutters. (ae) are migration results for five different test scenarios proposed in Feng et al. [79]’s paper.
Remotesensing 15 05173 g008
Figure 9. The CE-5 radar observations on the lunar surface (adopted from Su et al. [23] and Feng et al. [25]). (a) Drill a bit of pressure with depth. (b) Radar imaging before drilling. (c) Radar imaging after drilling. The white line represents the drill pipe. (df) are the imaging results of Feng et al. [25].
Remotesensing 15 05173 g009
Figure 10. Dielectric permittivity and loss tangent estimation using the radar data [23]. (a) a graph showing the estimated permittivity’s histogram. (b) The histogram of the estimated permittivity. (cf) Comparison of depth and average power, the red fitting curve indicates the attenuation rate of radar waves.
Remotesensing 15 05173 g010
Figure 11. The findings were obtained through laboratory tests of lunar regolith samples collected during the CE-5 mission for loss tangent and dielectric permittivity (adopted from Su et al. [23]). (a,b) In the frequency band range of 1–3 GHz, the relative loss tangent and dielectric permittivity of the regolith sample from the CE-5 mission were subsequently calculated. (c) Measurements of the Apollo sample were used to determine the link between dielectric permittivity and bulk density. (d) The relationship between the loss tangent and the wt% content of TiO 2 + FeO.
Remotesensing 15 05173 g011
Figure 12. The craters around the area of CE-5 landing (adopted from Jia et al. [93]). (a) Red circles indicate the locations of each source crater in unit P58. (b) Source craters within 40 km. (c) Source craters within 1 km. Red star indicates the location of the CE-5 lander.
Remotesensing 15 05173 g012
Figure 13. Geological profile of shallow lunar regolith at the CE-5 landing site (modified from Su et al. [23] and Qian et al. [94]). (a) Geological background images around the landing site [23]; (b) Schematic diagram of the geological profile of shallow lunar regolith revealed by CE-5 radar at a depth of 2.5 m [23]. (c) Stratigraphic structure of the CE-5 landing site [94].
Remotesensing 15 05173 g013
Table 1. Main parameters of LRPR and LPR radar [5,34,54,55].
RadarLPRLRPR
ChannelCH1CH2-
Center frequency60 MHz500 MHz2000 MHz
Working bandwidth40–80 MHz250–750 MHz1–3 Ghz
Detection depth≥100 m≥30 m≥2 m
Vertical resolution∼1 m≤30 cm∼5 cm
Table 2. Contribution to ejecta deposit thickness from Qian et al. [94] (marked in background color gray) and Jia et al. [93] (marked in background color white), and there is the contribution of ejecta materials from large craters to the CE-5 landing area [95].
No.CraterLongitude (°)Latitude (°)Diameter (m)Contribution (cm)
1IC-396−51.93243.066419404.6
C1−51.93643.062408.530.0
2IC-265−51.9243.05998312.7
C2−51.92243.056104.612.0
3IC-266−51.91743.0547245.6
C3−51.90743.070225.41.9
4IC-259−51.91643.0591133.9
C4−51.91643.073194.31.0
5IC-261−51.91543.058923.5
C5−51.91143.062105.90.9
6IC-320−51.90943.06410419.6
C6−51.91743.047114.90.8
7IC-406−51.90643.07218717
C7−51.90943.047124.80.6
8IC-400−51.91543.04911116.3
C8−51.91143.067127.60.4
9IC-268−51.91443.0592515.9
C9−51.94443.035225.60.4
10IC-263−51.91743.0592014.1
C10−51.91443.0661.00.4
11IC-440−51.90843.04912112.1
C11−51.92743.048100.90.3
12IC-262−51.91743.0581010.9
C12−51.94543.070168.30.2
Large crater (>17 km):
Harpalus−43.49052.73039,77010.2
Copernicus−20.0609.64094,3007.6
Aristarchus−47.49023.74040,1402.7
Harding−71.68043.54023,0400.9
Kepler−38.0008.11030,1200.2
Disclaimer/Publisher’s Note: The statements, opinions and data contained in all publications are solely those of the individual author(s) and contributor(s) and not of MDPI and/or the editor(s). MDPI and/or the editor(s) disclaim responsibility for any injury to people or property resulting from any ideas, methods, instructions or products referred to in the content.

