Article

Performance Analysis of Channel Imbalance Control and Azimuth Ambiguity Suppression in Azimuth Dual Receiving Antenna Mode of LT-1 Spaceborne SAR System

1
National Key Laboratory of Microwave Imaging Technology, Aerospace Information Research Institute, Chinese Academy of Sciences, Beijing 100190, China
2
School of Electronic, Electrical and Communication Engineering, University of Chinese Academy of Sciences, Beijing 100049, China
*
Author to whom correspondence should be addressed.
Remote Sens. 2023, 15(11), 2765; https://doi.org/10.3390/rs15112765
Submission received: 20 February 2023 / Revised: 3 April 2023 / Accepted: 8 April 2023 / Published: 26 May 2023
(This article belongs to the Special Issue SAR-Based Signal Processing and Target Recognition)

Abstract

:
The LuTan-1(LT-1), known as the L-band differential interferometric synthetic aperture radar (SAR) satellite system, is an essential piece of civil infrastructure in China, providing extensive applications such as surface deformation monitoring and topographic mapping. To achieve high-resolution and wide-swath (HRWS) observation abilities, the LT-1 takes the dual receiving antenna (DRA) imaging mode as its working mode. However, amplitude and phase errors between channels lead to a mismatch between the reconstruction filter and the multichannel echo signal, worsen the reconstructed azimuth spectrum, and introduce ambiguity targets in the final imaging results, seriously affecting the final imaging quality. In order to better evaluate the channel error and azimuth ambiguity performance of the LT-1 system, this paper proposed an advanced channel consistency correction method and conducted many measured data experiments. The experimental results show that the proposed method is effective, and the LT-1 system has excellent channel error control and azimuth ambiguity performance.

1. Introduction

Synthetic aperture radar (SAR) is an all-day and all-weather active microwave remote sensing tool with powerful Earth observation capability [1]. High resolution can provide detailed feature information of observation scenes, and wide-swath imaging can provide extensive scene information. Therefore, high-resolution and wide-swath (HRWS) imaging is a significant trend in modern SAR systems [2,3,4,5,6,7,8,9]. However, it is an irreconcilable contradiction to improve azimuth resolution and range swath. High-resolution imaging requires higher pulse frequency repetition (PRF) to satisfy the Nyquist sampling theorem, while wide-swath imaging requires lower PRF to ensure a sufficient echo-receiving window [10,11]. It is hard for the traditional SAR system to realize HRWS imaging simultaneously. Fortunately, by reconstruction algorithm, digital beamforming (DBF) technology can recover a full alias-free spectrum from the aliasing spectrum and suppress azimuth ambiguity caused by low PRF [3,12,13]. Therefore, an azimuth multichannel SAR system can realize HRWS imaging with DBF technology. Azimuth multichannel (AMC) technology was first applied in the TerraSAR-X satellite launched by Germany in 2007 [12]. The experimental results show that DBF has good azimuth ambiguity suppression ability. Then, the ALOS-2 satellite launched by Japan in 2014 first used the dual-antenna receiving (DRA) mode as a working mode [14]. In 2016, China’s first dual-channel spaceborne SAR sensor, the Gaofen-3 satellite, was launched [15,16]. In recent years, AMC technology has been widely used in spaceborne SAR.
LuTan-1 (LT-1) [17], a vital component of the “China National Civil Space Infrastructure Long-Term Development Plan (2015–2025)”, is an innovative spaceborne Earth observation constellation. It consists of two identical satellites carrying advanced, fully polarized L-band SAR capable of obtaining SAR images. The LT-1’s primary aim is to acquire global surface deformation measurement and digital elevation model (DEM). LT-1 data can also serve multiple industries such as land, earthquake, surveying and mapping, environment, disaster mitigation, and forestry. Achieving tasks such as surface deformation monitoring and topographic mapping in a given area requires extensive coverage capabilities, and higher spatial resolution is essential for disaster monitoring. Therefore, to achieve HRWS imaging, LT-1 uses DRA mode as its operating mode. The duration of its mission is divided into two phases. In phase I, two satellites fly in a formation with a variable baseline. The bistatic InSAR strip map mode is utilized to acquire global digital elevation and terrain models with high accuracy and spatial resolution [18]. In phase II, two satellites shall share the standard reference orbit with a 180° orbital phasing difference. LT-1 will continue to provide high-quality observation data throughout its future life cycle, providing new possibilities, advances, and relevant information for dynamic monitoring on land.
Although AMC SAR has many advantages, using multiple channels to receive echo signals also brings a variety of error sources, including phase synchronization error, baseline error, channel error, and attitude error [19,20,21]. These errors lead to inconsistent amplitude and phase characteristics of each channel’s echo, seriously restricting the performance of the AMC SAR system. To meet the requirements of interferometric altimetry and deformation measurement, LT-1 built a high-precision spaceborne internal calibration system consisting of internal calibrators, antenna calibration networks, and interconnection cables. The system includes three calibration loops: no delay calibration loop, delay calibration loop, and synchronous calibration loop. It is difficult for the internal calibration system to achieve high-precision calibration by relying on onboard self-service. Then, LT-1 compensates through ground processing, including the temperature curve data, to compensate for amplitude and phase errors. The LT-1 can obtain an amplitude-temperature curve and phase-temperature curve by setting temperature points reasonably in the antenna calibration network or internal calibrator through temperature experiments in the ground test. When in orbit, it can use the measured temperature value and temperature curve to compensate for the amplitude-phase calibration results of the system during ground data processing. Using temperature compensation measures, LT-1 can achieve the internal calibration index requirements of the amplitude of no more than 0.4 dB and phase of no more than 3°. The two main factors of channel amplitude-phase inconsistency are the phase center deviation error of receiving antenna and amplitude-phase error caused by channel characteristics. Internal calibration technology can only measure the amplitude and phase errors of the channel itself, but not the amplitude and phase characteristics of the passive part of the antenna. Therefore, the channel errors caused by antenna phase center errors and other residual channel errors must be corrected before imaging by other channel consistency correction techniques [12,22].
Channel consistency correction methods mainly include external calibration and self-calibration methods based on echo data. The external calibration technology provides end-to-end absolute measurement and calibration of SAR system parameters and their changes through the standard calibration equipment deployed in the ground calibration field. It covers the whole channel link and has high calibration accuracy. However, the external calibration technology needs to lay out the calibration equipment in the scene, so the flexibility needs to be improved. In contrast, the self-calibration method estimates the channel error by processing the original data and does not need additional calibration equipment. At the same time, the estimation accuracy of the self-correction method has been dramatically improved through constant updating and iteration. Currently, the commonly used self-calibration methods include the signal subspace method (SSP) [23], azimuth time domain cross-correlation method (ATC) [24], minimum variance distortionless response method (MVDR) [25], the image weighted minimum entropy method (WME) [26,27], the image least L1-norm method (LLN) [19], maximum normalized image sharpness method (MNIS) [20], and the minimizing the sum of the sub-band norm method (MSSBN) [28]. Considering the estimation accuracy and computational efficiency, this paper proposes a phase error estimation method that maximizes the L1 norm of the sum (MLNS) of multichannel 2-Dimension (2D) frequency domain echo signals based on the MSSBN method. This paper uses this new method to estimate and correct the channel amplitude and phase errors of LT-1.
LT-1 has been in orbit for nearly a year, accumulating much observation data from different scenarios under different operating modes. This paper aims to evaluate the channel error control capability of the LT-1 system by estimating the channel amplitude-phase error of the DRA receive data and to study its performance by focusing on the azimuth ambiguity of the image. Experiments include different incident angles and representative scene types. The experimental results demonstrate the excellent channel error control and azimuth ambiguity suppression capability of LT-1.
The paper is organized as follows. The second part of this paper briefly introduces the channel error model of a dual-channel SAR system. The third parts show the influence of channel error on imaging through simulation experiments. Section 4 proposes a new phase error estimation and correction method, and the measured data results of LT-1 are given and analyzed in detail. Finally, Section 5 summarizes the system performance of LT-1 and discusses its future application prospects.

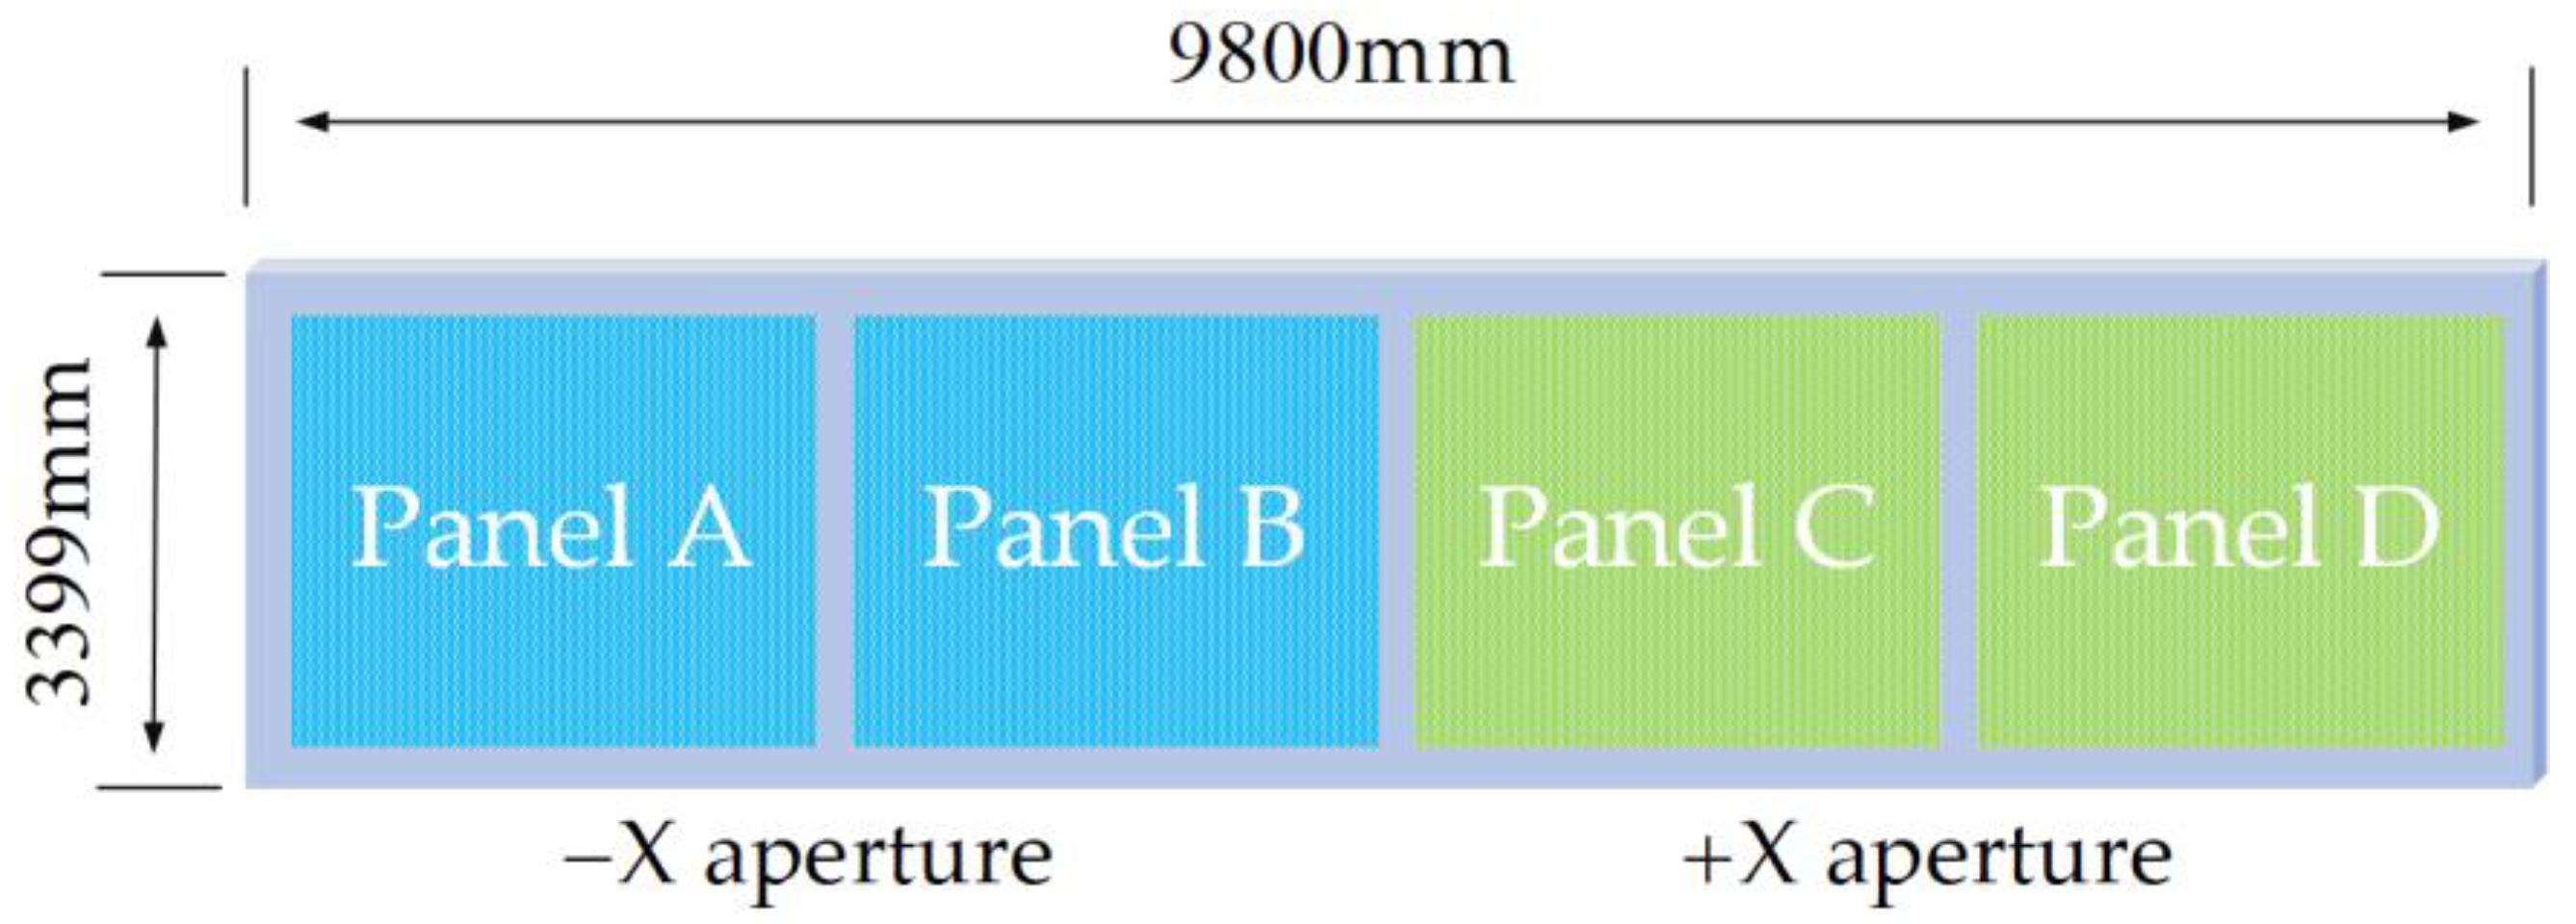
2. LT-1 DRA Mode and Channel Error Model

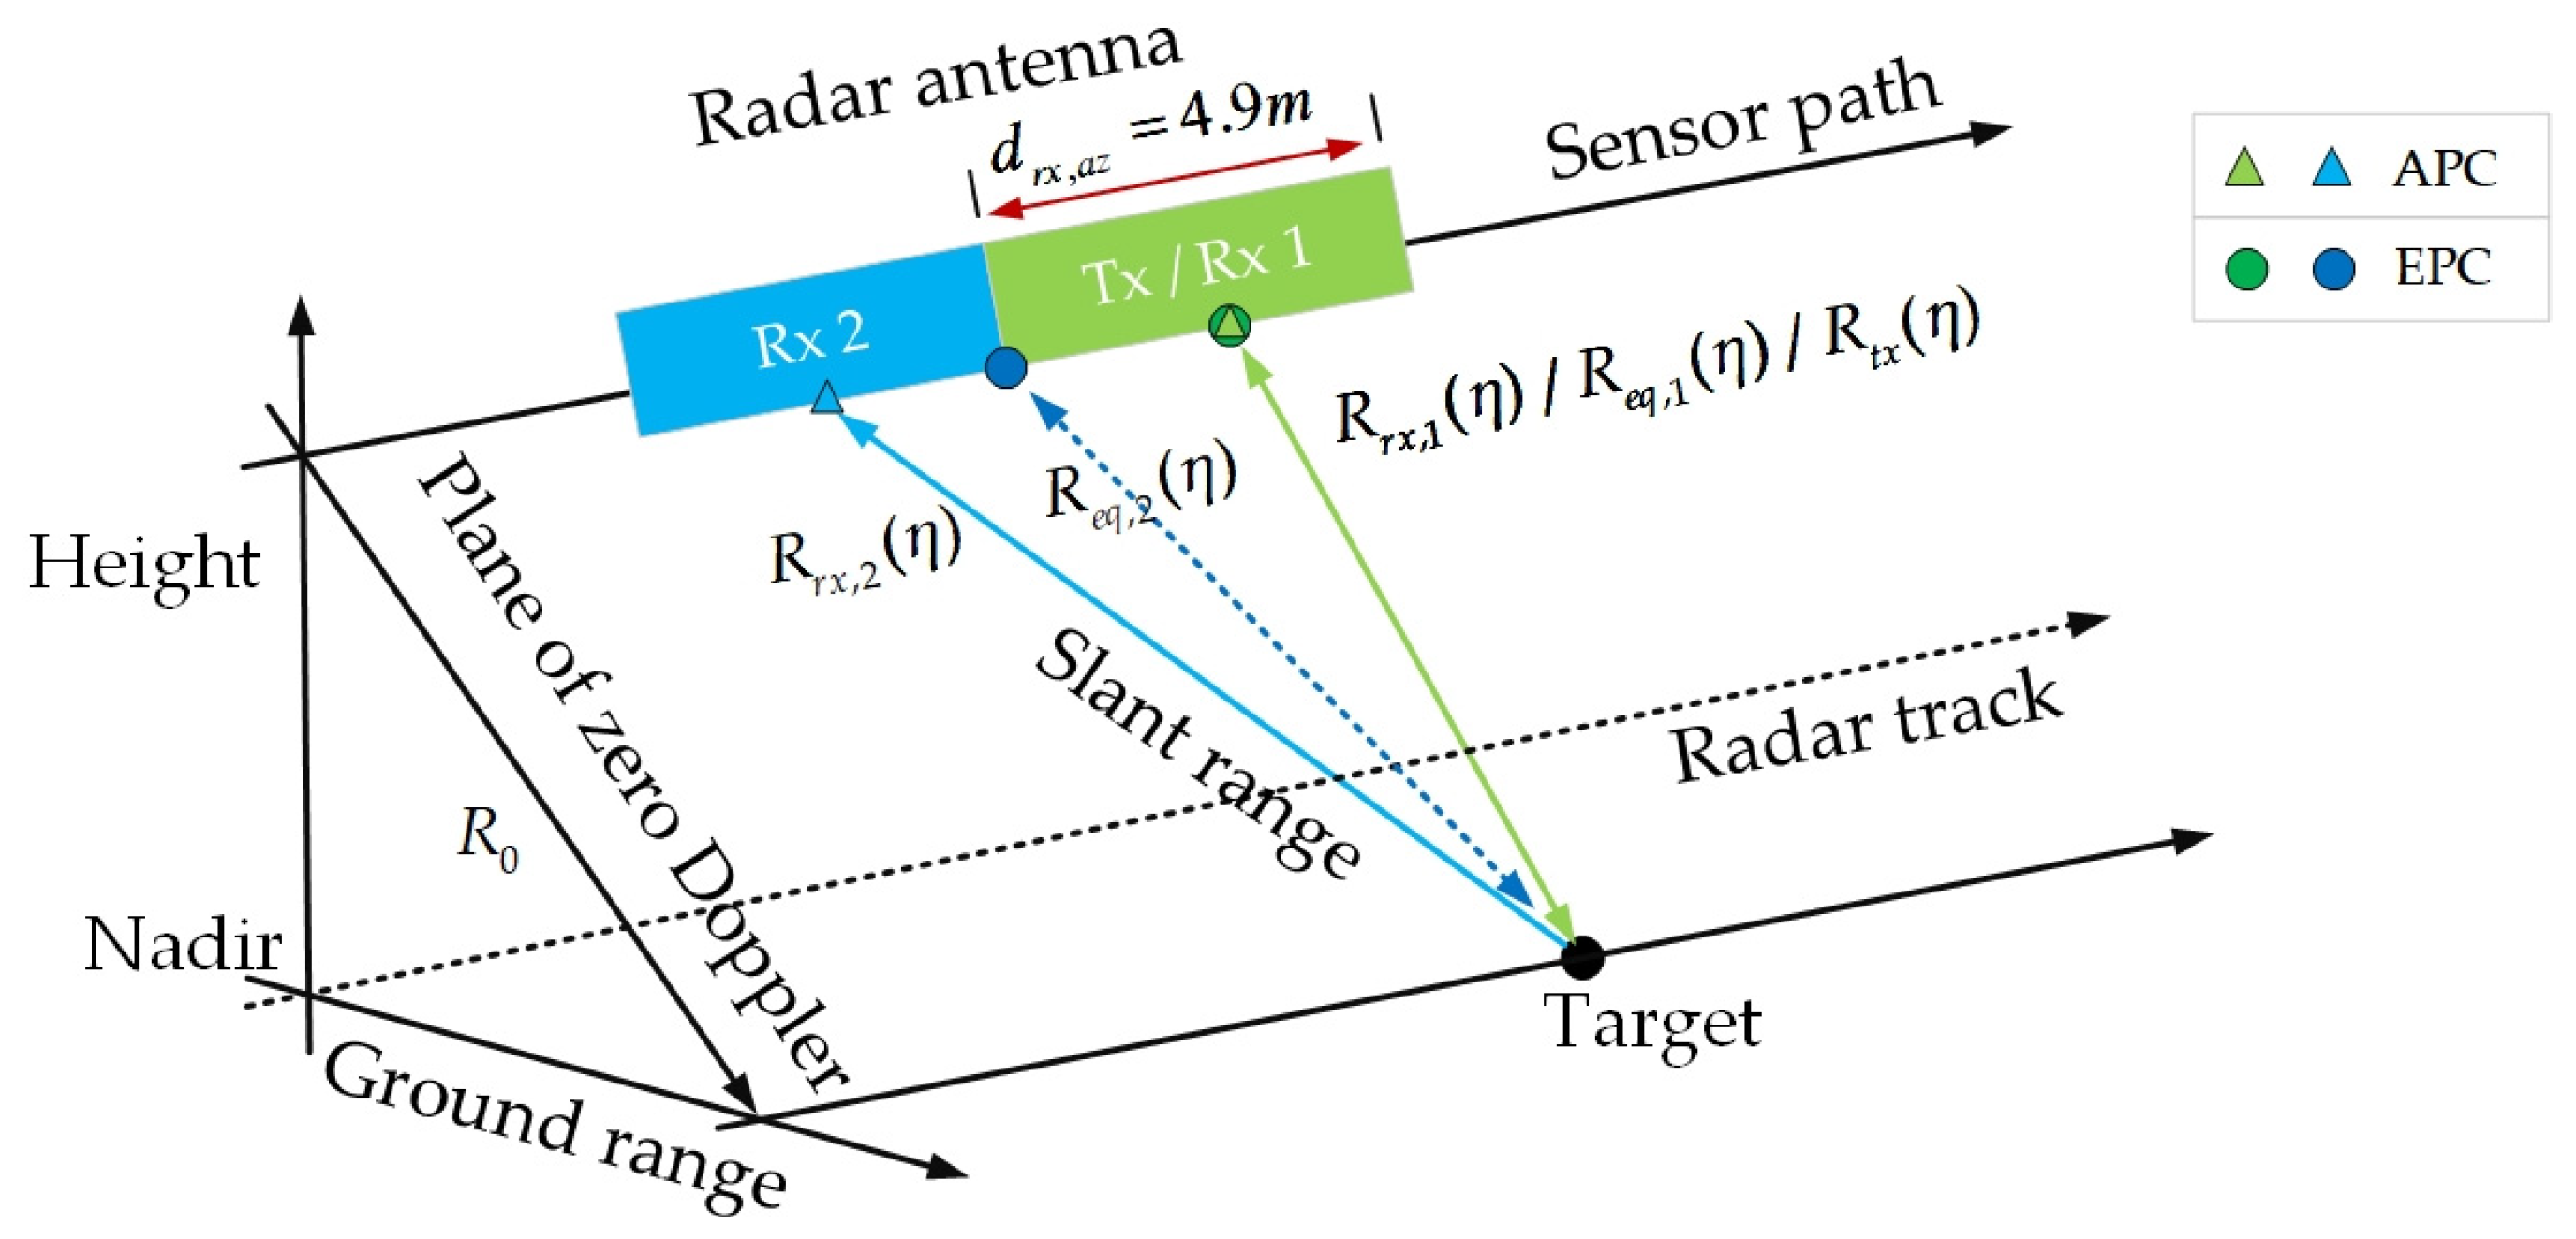
2.1. LT-1 Signal Model and Channel Constant Amplitude-Phase Error

Figure 1 is a brief illustration of the imaging geometry of the LT-1 DRA mode. The LT-1 normal orbit flight posture is on the right, and there is a need to adjust to the left view mode. The antenna phase center (APC) settings of LT-1 are shown in Figure 1, the antenna transmits chirp signals at the Tx channel, and two separate channels (Rx 1 and Rx 2) in azimuth receive echoes simultaneously. The aperture size is set to d r x , a z , and the distance between two receive channels is 4.9 m. The echo history of the signal received by the m th channel and the echo history of the signal received by the m th equivalent phase center in self-transmit and self-received can be expressed, respectively, as
R m ( η ) = R r x , m ( η ) + R t x , m ( η ) = R 0 2 + V s 2 ( η Δ x m V s ) 2 + R 0 2 + V s 2 η 2   2 R 0 + V s 2 ( η Δ x m 2 V s ) 2 R 0 + Δ x m 2 4 R 0
R e q , m ( η ) = 2 R 0 2 + V s 2 ( η Δ x m 2 V s ) 2 2 R 0 + V s 2 ( η Δ x m 2 V s ) 2 R 0
where R r x , m , R t x , m η , R 0 , V s donate the range history from target to receive channel, range history from target to transmission channel, azimuth slow time, nearest slant range, and satellite speed of the LT-1 SAR system, respectively. Δ x m = ( m m r e f ) d r x , a z donates the distance between the m th channel and the reference channel. According to Equation (1), the 2-D time domain echo signal of the m th equivalent phase center (EPC) can be expressed as
s e q , m ( τ , η ) = w r ( τ R e q , m ( η ) c ) w a ( η η c )                                                                 × exp { j 4 π λ R e q , m ( η ) } exp { j π K r ( τ 2 R e q , m ( η ) c ) 2 }
where τ , w r , w a , η c , λ , K r and c denote the range fast time, range signal envelop, azimuth signal envelop, azimuth center time, wavelength, chirp rate, and velocity of light, respectively. The difference between R m ( η ) and R e q , m ( η ) is Δ x m 2 / 4 R 0 after Taylor expansion is shown in Equations (1) and (2). Therefore, the 2-D time domain echo signal of the m th channel can be expressed as
s m ( τ , η ) = s e q , m ( τ , η ) × exp { j π Δ x m 2 2 λ R 0 }
AMC SAR system adopts multiple channels for sampling. It uses the increase in spatial dimension sampling to exchange for the decrease in temporal dimension sampling [3], which makes the performance of an HRWS realized. Multichannel systems require multichannel echo signal reconstruction processing, and the key to reconstruction is to ensure that the reconstruction filter is consistent with the echo signal. That is, the echo signal amplitude and phase between channels are consistent. However, in actual operation, due to various factors such as electronic equipment, antenna arrays, and satellite platforms [23] in each channel, amplitude, and phase errors inevitably exist between the echo signals in each channel. Final imaging quality will be seriously affected if the above errors are uncompensated. The satellite platform operates very stably for spaceborne SAR systems during startup time. Then the attitude, velocity, and orbit curvature errors involved in the satellite platform can be ignored [29,30]. Radar electronic equipment can introduce amplitude, phase, and range sampling time errors in the echo signal due to processing technology, device aging, and temperature changes. However, since the LT-1 SAR system operates in the L-band, the impact of range sampling time error can be ignored. At the same time, channel errors caused by radar electronics are generally considered stable during a startup operation [30]. Therefore, considering only the errors introduced by radar electronics, error models can be established as
s m e ( τ , η ) = α m s m ( τ , η ) exp ( j ψ m )
where α m and ψ m are amplitude error and phase error, respectively, the error takes the channel of the first antenna as a reference, then α 1 r = 1 , ψ 1 r = 0 .

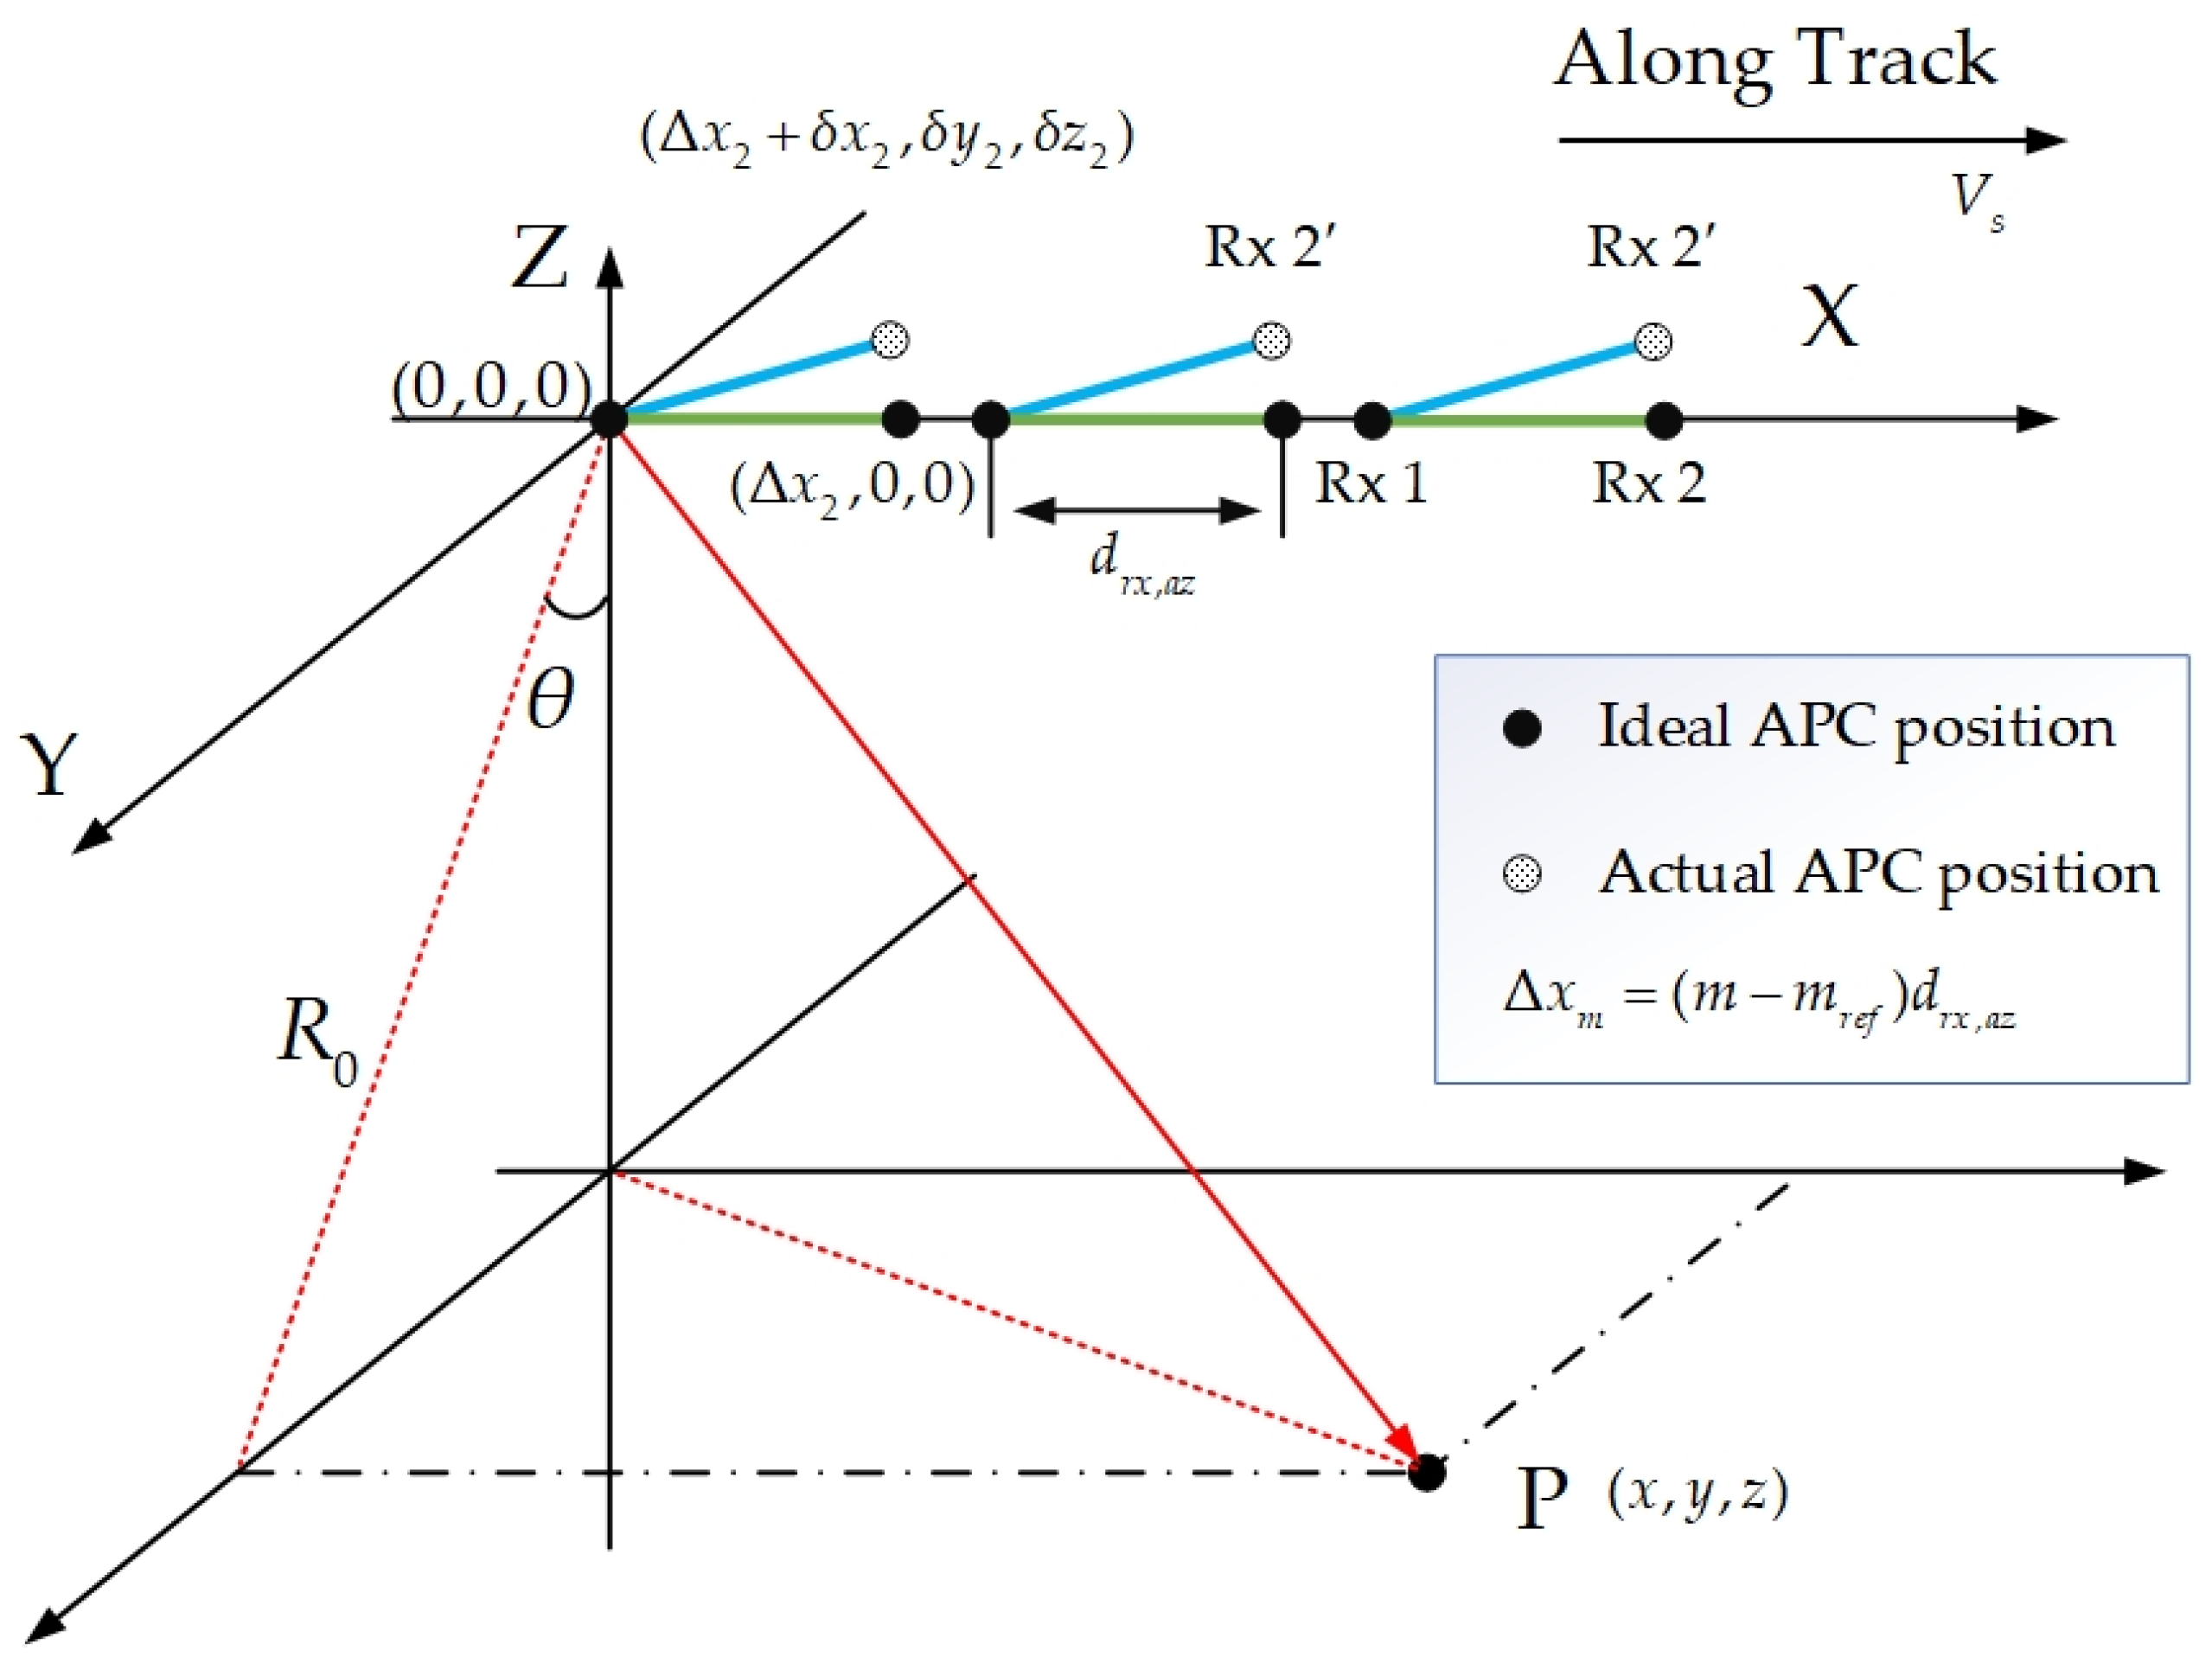
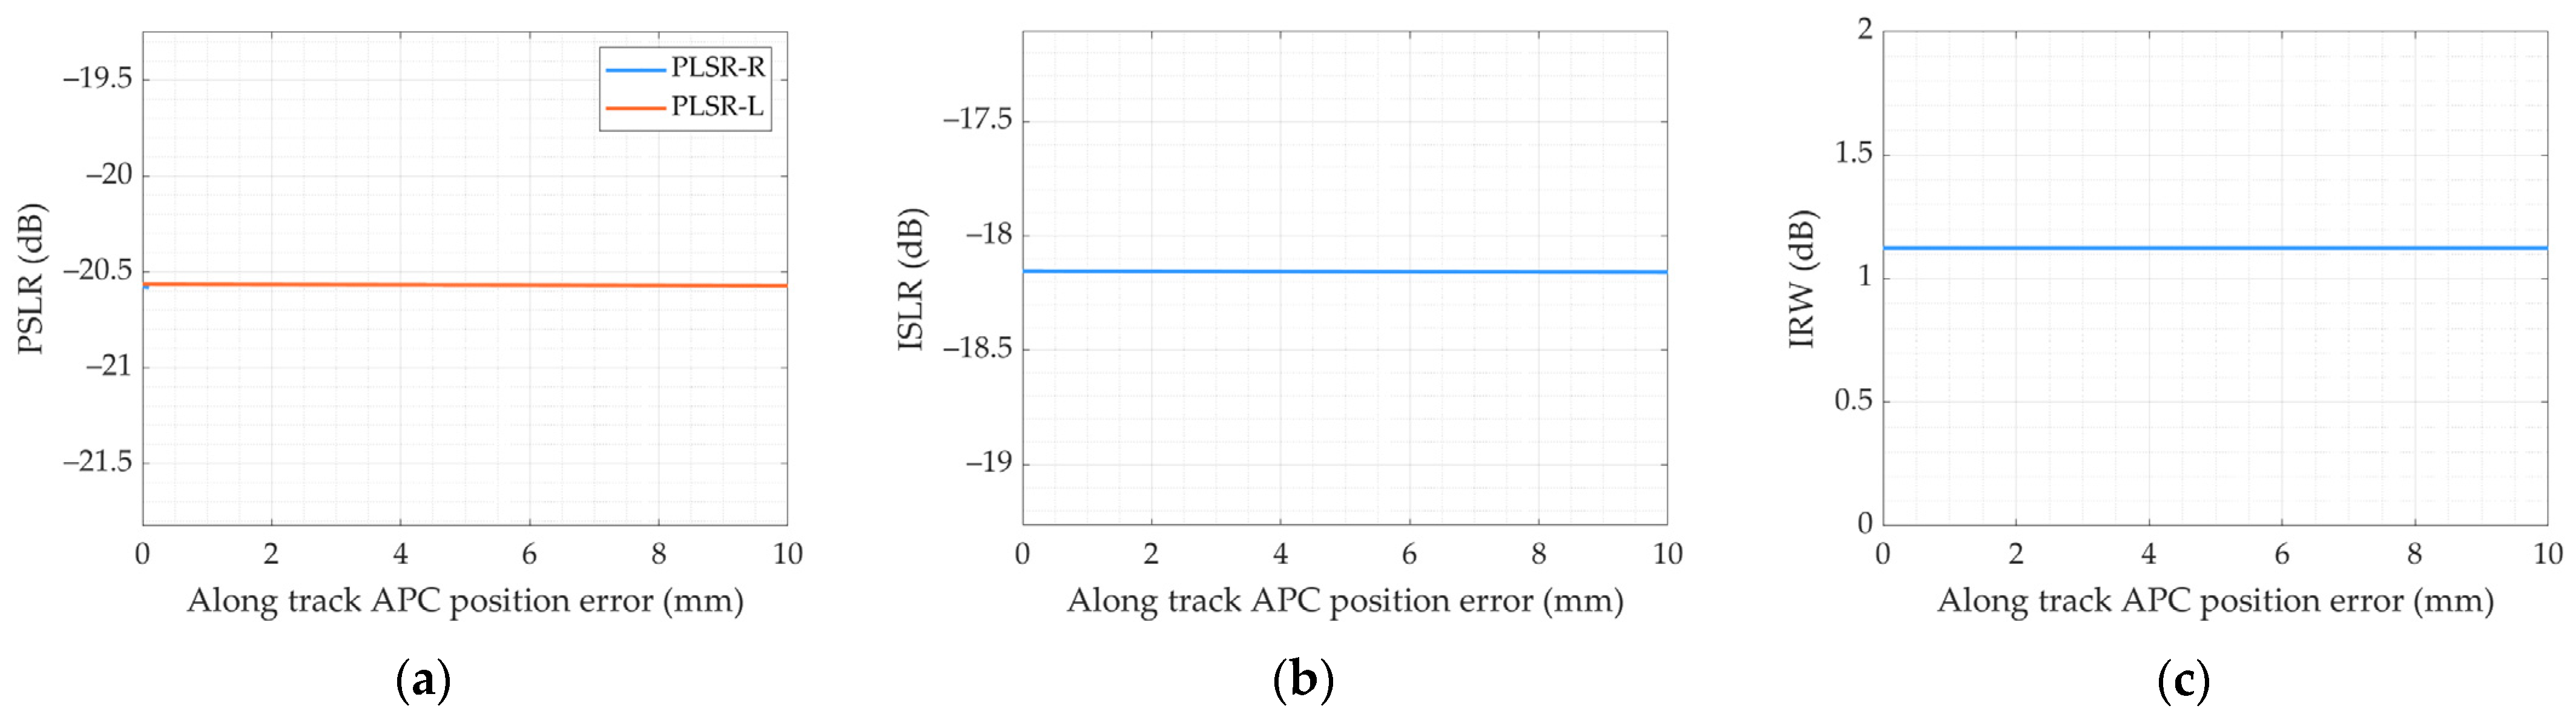
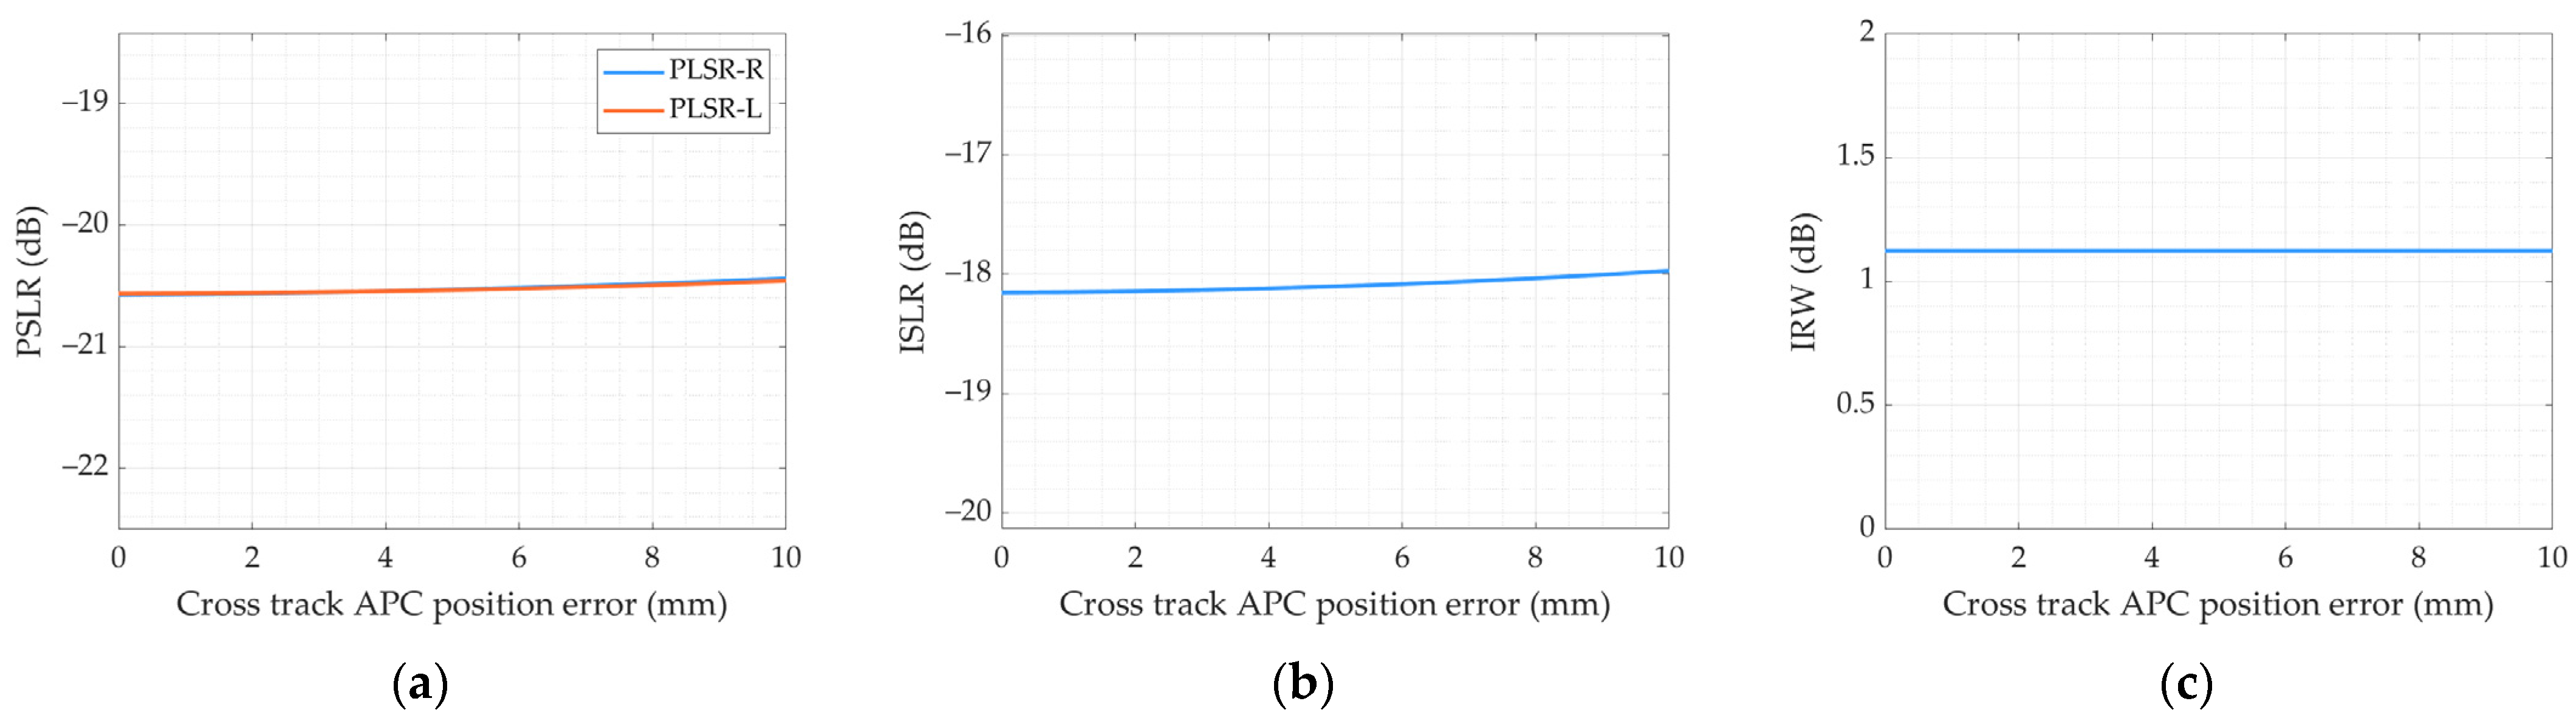
2.2. APC Position Error

In addition to the amplitude error, phase error, and range sampling time error caused by the electronic equipment of the SAR system, APC position error also introduces significant phase errors. APC position error is affected by antenna thermal deformation, installation error, satellite attitude error, and other factors. At the same time, phase error caused by APC position error is affected by the incident angle and radar operating wavelength. Therefore, this section will quantitatively analyze the APC position error of the dual-channel SAR system. Figure 2 shows the geometric schematic diagram of the APC position error.
Firstly, the spatial coordinate system of the AMC SAR system is defined as:
  • The X-axis direction is the satellite track direction.
  • The Y-axis direction is perpendicular to the X-axis direction.
  • The Z-axis faces away from the center of the Earth.
  • The P point is the target point.
The first antenna coordinate is (0,0,0), and the solid circles represent the ideal position of the APC, all on the X-axis. In contrast, the hollow circles represent the actual APC position, which deviates from the ideal position. Set the APC position deviation of the m th antenna as ( δ x m , δ y m , δ z m ) , and take the first antenna as the reference channel, then its position error is ( δ x 1 , δ y 1 , δ z 1 ) = ( 0 , 0 , 0 ) . The APC position error will change the distance between the APC and the target.
When there is no APC position error, the phase center coordinate of the m th antenna is ( Δ x m + V s η , 0 , 0 ) . If the coordinate of the point target is ( x , y , z ) , then the distance from the APC to the point target can be expressed as
R r x , m = ( x Δ x m V s η ) 2 + ( y ) 2 + ( z ) 2
When the APC position error exists, the APC coordinate of the m th antenna is ( Δ x m + δ x m + V s η , δ y m , δ z m ) , then the distance between the antenna and the target is expressed as
R r x , m = ( x Δ x m δ x m V s η ) 2 + ( y δ y m ) 2 + ( z δ z m ) 2
Then, by combining Equations (3)–(5) and (7), the echo signal with APC position error can be expressed as
s m e ( τ , η ) = α m w r ( τ R e q , m ( η ) c ) w a ( η η c )   × exp { j 4 π λ R e q , m ( η ) } exp { j π K r ( τ 2 R e q , m ( η ) c ) 2 } exp { j ψ m }
The Taylor expansion is carried out on Equation (7), and the square term of the error minor term and the term of third or higher order are ignored. Then the distance history can be approximated as follows
R r x , m = R r x , m x Δ x m V s η R r x , m δ x m y R r x , m δ y m z R r x , m δ z m
According to Equation (9), the phase error generated by the APC position deviation can be expressed as
δ φ m = 4 π λ ( R r x , m R r x , m ) 2 = 2 π λ x Δ x m V s η R r x , m δ x m 2 π λ y R r x , m δ y m 2 π λ z R r x , m δ z m
Since x y , x z , the above equation can be simplified as
δ φ m x 2 π λ x Δ x m V s η y 2 + z 2 δ x m
δ φ m y 2 π λ y y 2 + z 2 δ y m
δ φ m z 2 π λ z y 2 + z 2 δ z m
where δ φ m x , δ φ m y , δ φ m z are the phase errors caused by the deviation δ x m along the X-axis, δ y m along the Y-axis, and δ z m along the Z-axis, respectively. Among them, δ φ m y and δ φ m z are independent of azimuth time but related to the slant range of the echo, which is named the space-variant phase error in this paper. δ φ m x changes with azimuth slow time, referred to as azimuth time-variant phase error in this paper. Due to the Doppler effect, the azimuth slow time domain is also a linear frequency-modulated signal. The relation between azimuth slow time and Doppler frequency is as
η = x Δ x m V s λ y 2 + z 2 2 V s 2 f η
Substituting the above equation into Equation (11), the frequency domain form of time-variant phase error can be expressed as
δ φ m x = 2 π f η V s δ x m
According to the geometric diagram in Figure 2, Equations (12) and (13) can be written as expressions for the angle of view
δ φ m y = 2 π λ δ y m sin θ
δ φ m z = 2 π λ δ z m cos θ
where θ is the angle of view, thus, the space-variant phase error caused by the APC position error can be written as
δ φ m y z = 2 π λ ( δ y m sin θ + δ z m cos θ )
From the above analysis, it can be seen that the channel phase error caused by APC position error is related to not only wavelength and a function of view of angle. Therefore, the impact of APC position error on phase error is studied through simple simulation. Generally, the APC position error does not exceed 5 mm [30], while the APC position error caused by satellite attitude errors is less than 1 mm and can be ignored. Therefore, select a uniform distribution of δ y 2 and δ z 2 between −5 mm and 5 mm, θ = 40 ° , and compare the relationship between APC position error and phase error at different wavelengths. Secondly, compare the phase errors generated by APC position error at different antenna beams in the L-band. The relationship between the space-variation error, wavelength, and angle of view is shown in Figure 3.
From Figure 3a,b, the space-varying phase error caused by APC decreases with the increased wavelength. Therefore, unlike other bands, the L-band SAR satellite has a natural advantage in space-varying phase error control. From Figure 3c, the spatial variability of the phase is maximum when the | δ y m δ z m | maximum. As shown in Figure 3d, the phase error caused by APC position error can be considered approximately constant at the same antenna beam. Therefore, the error model shown in Equation (5) can be used when considering channel errors within a scene. In contrast, when considering channel errors over a wider swath, it is necessary to consider space-variant phase errors.

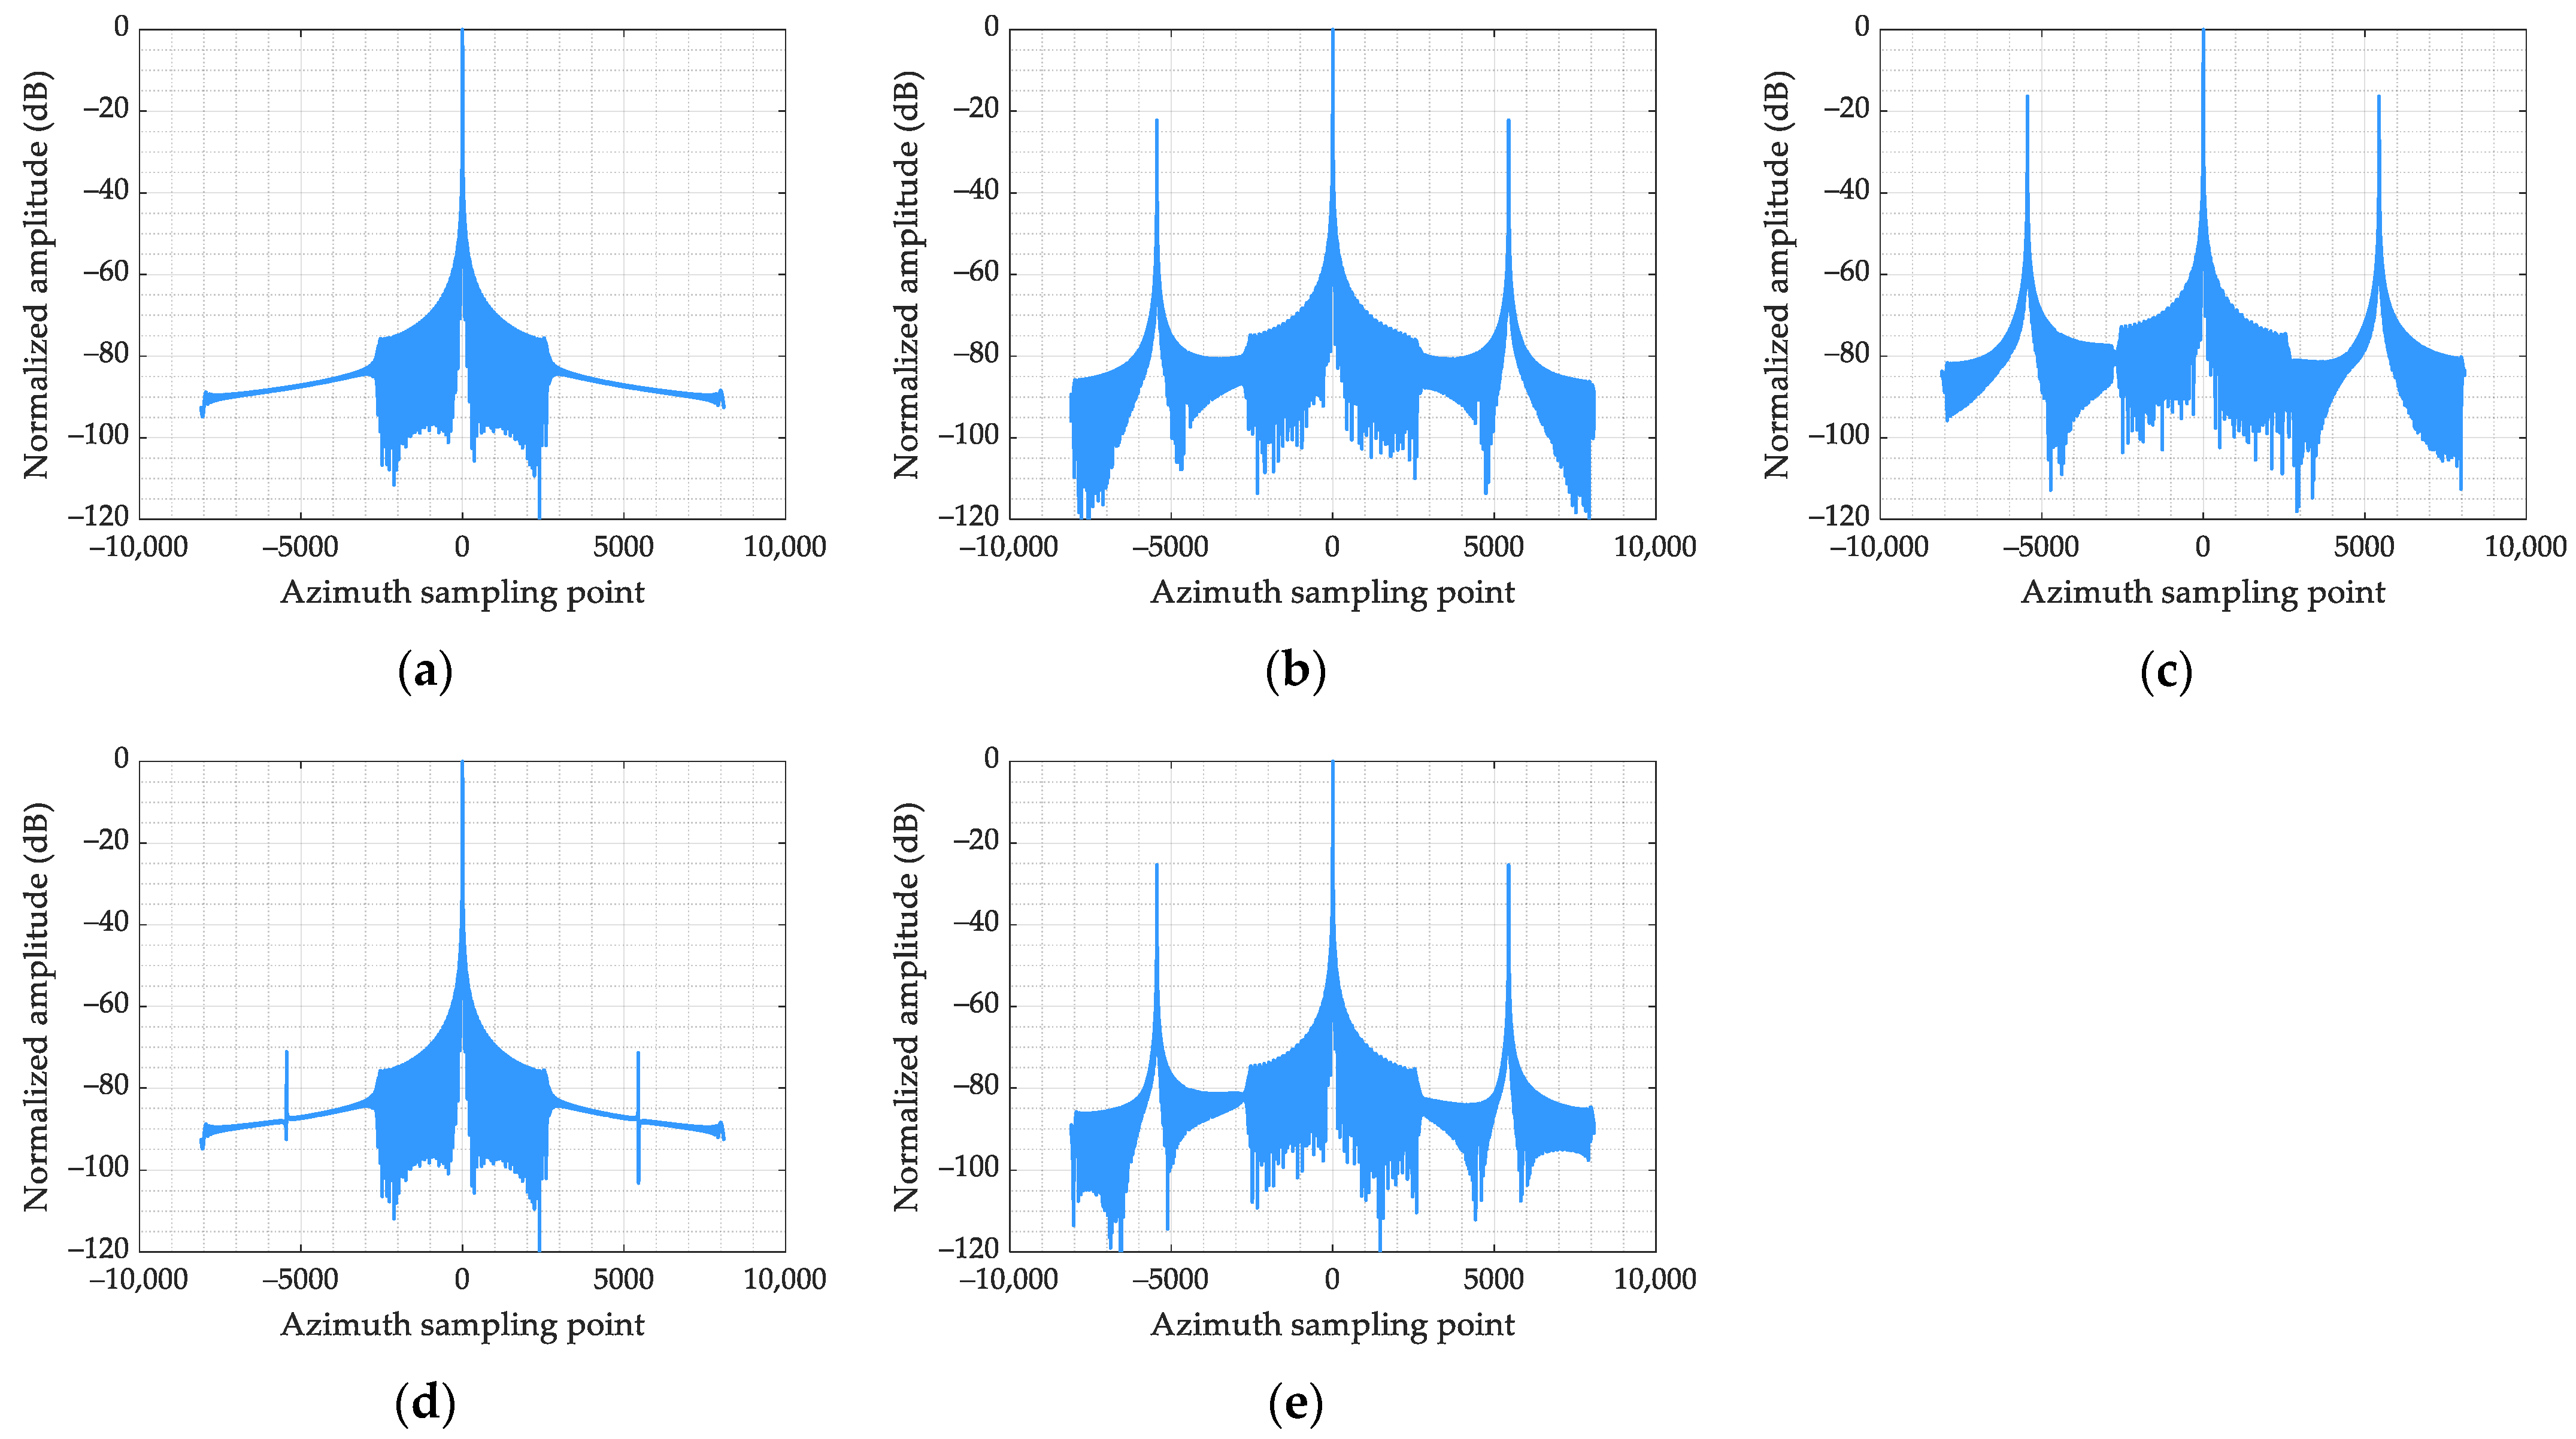
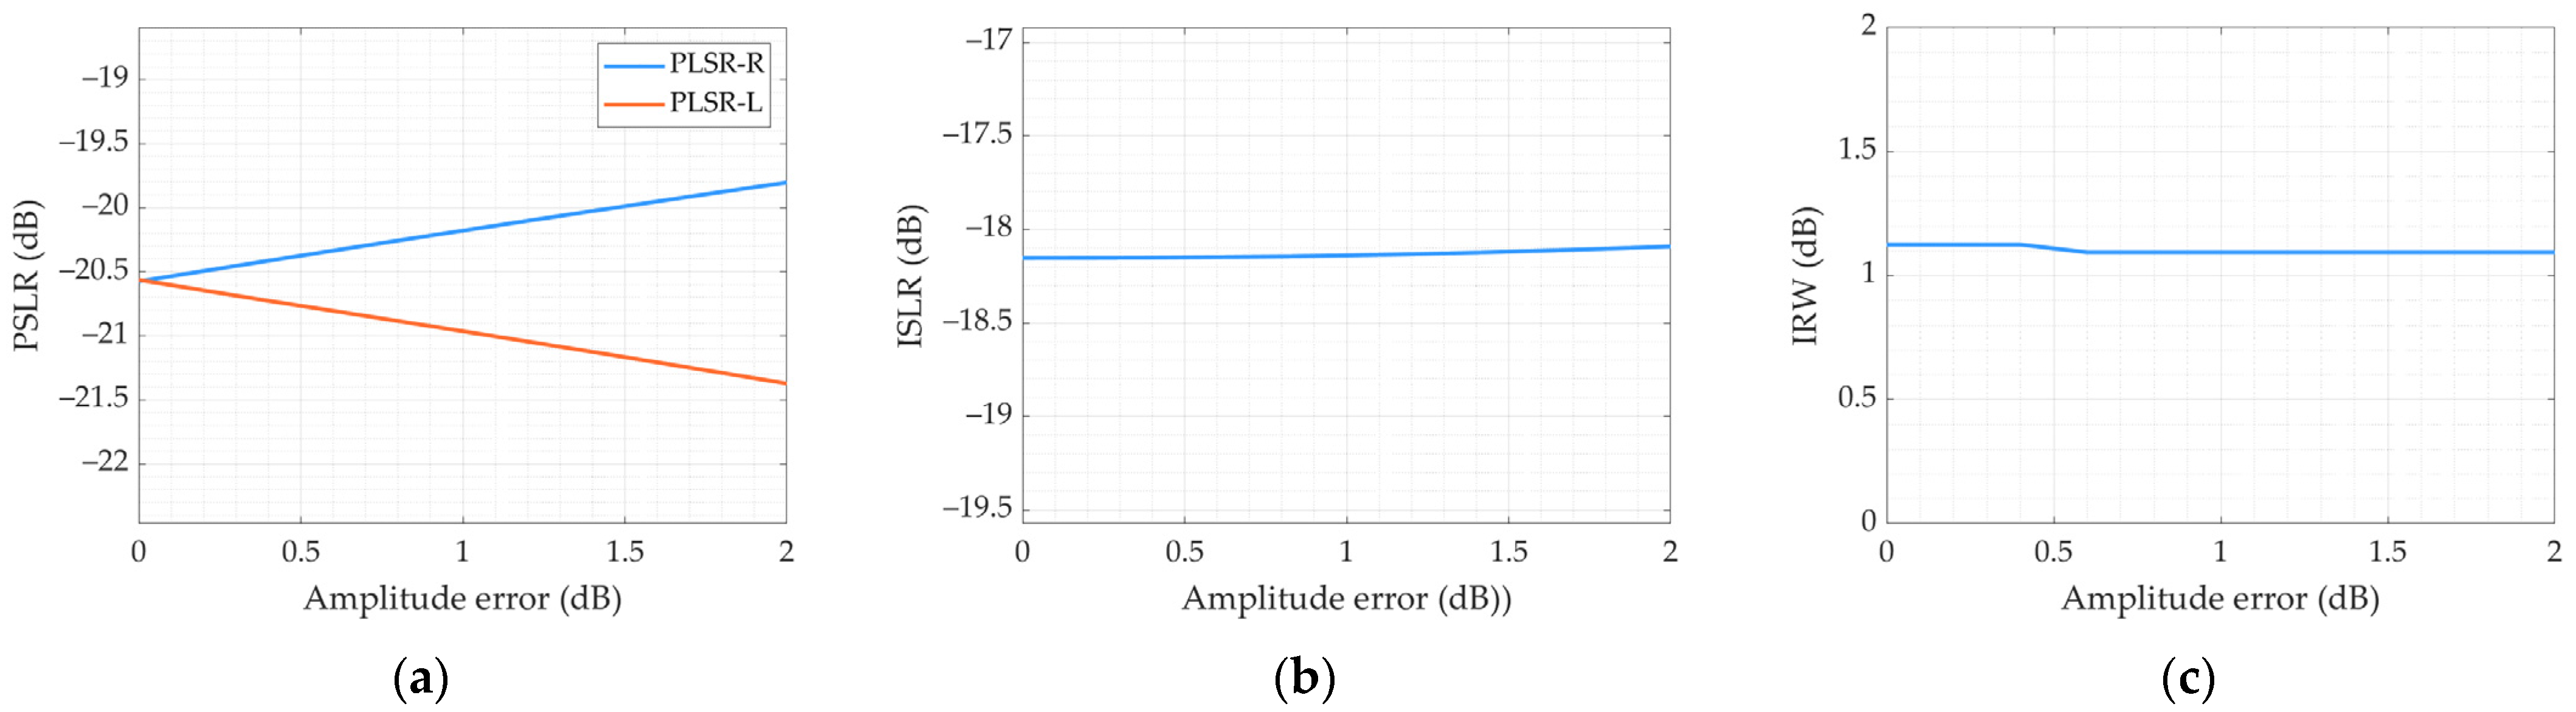
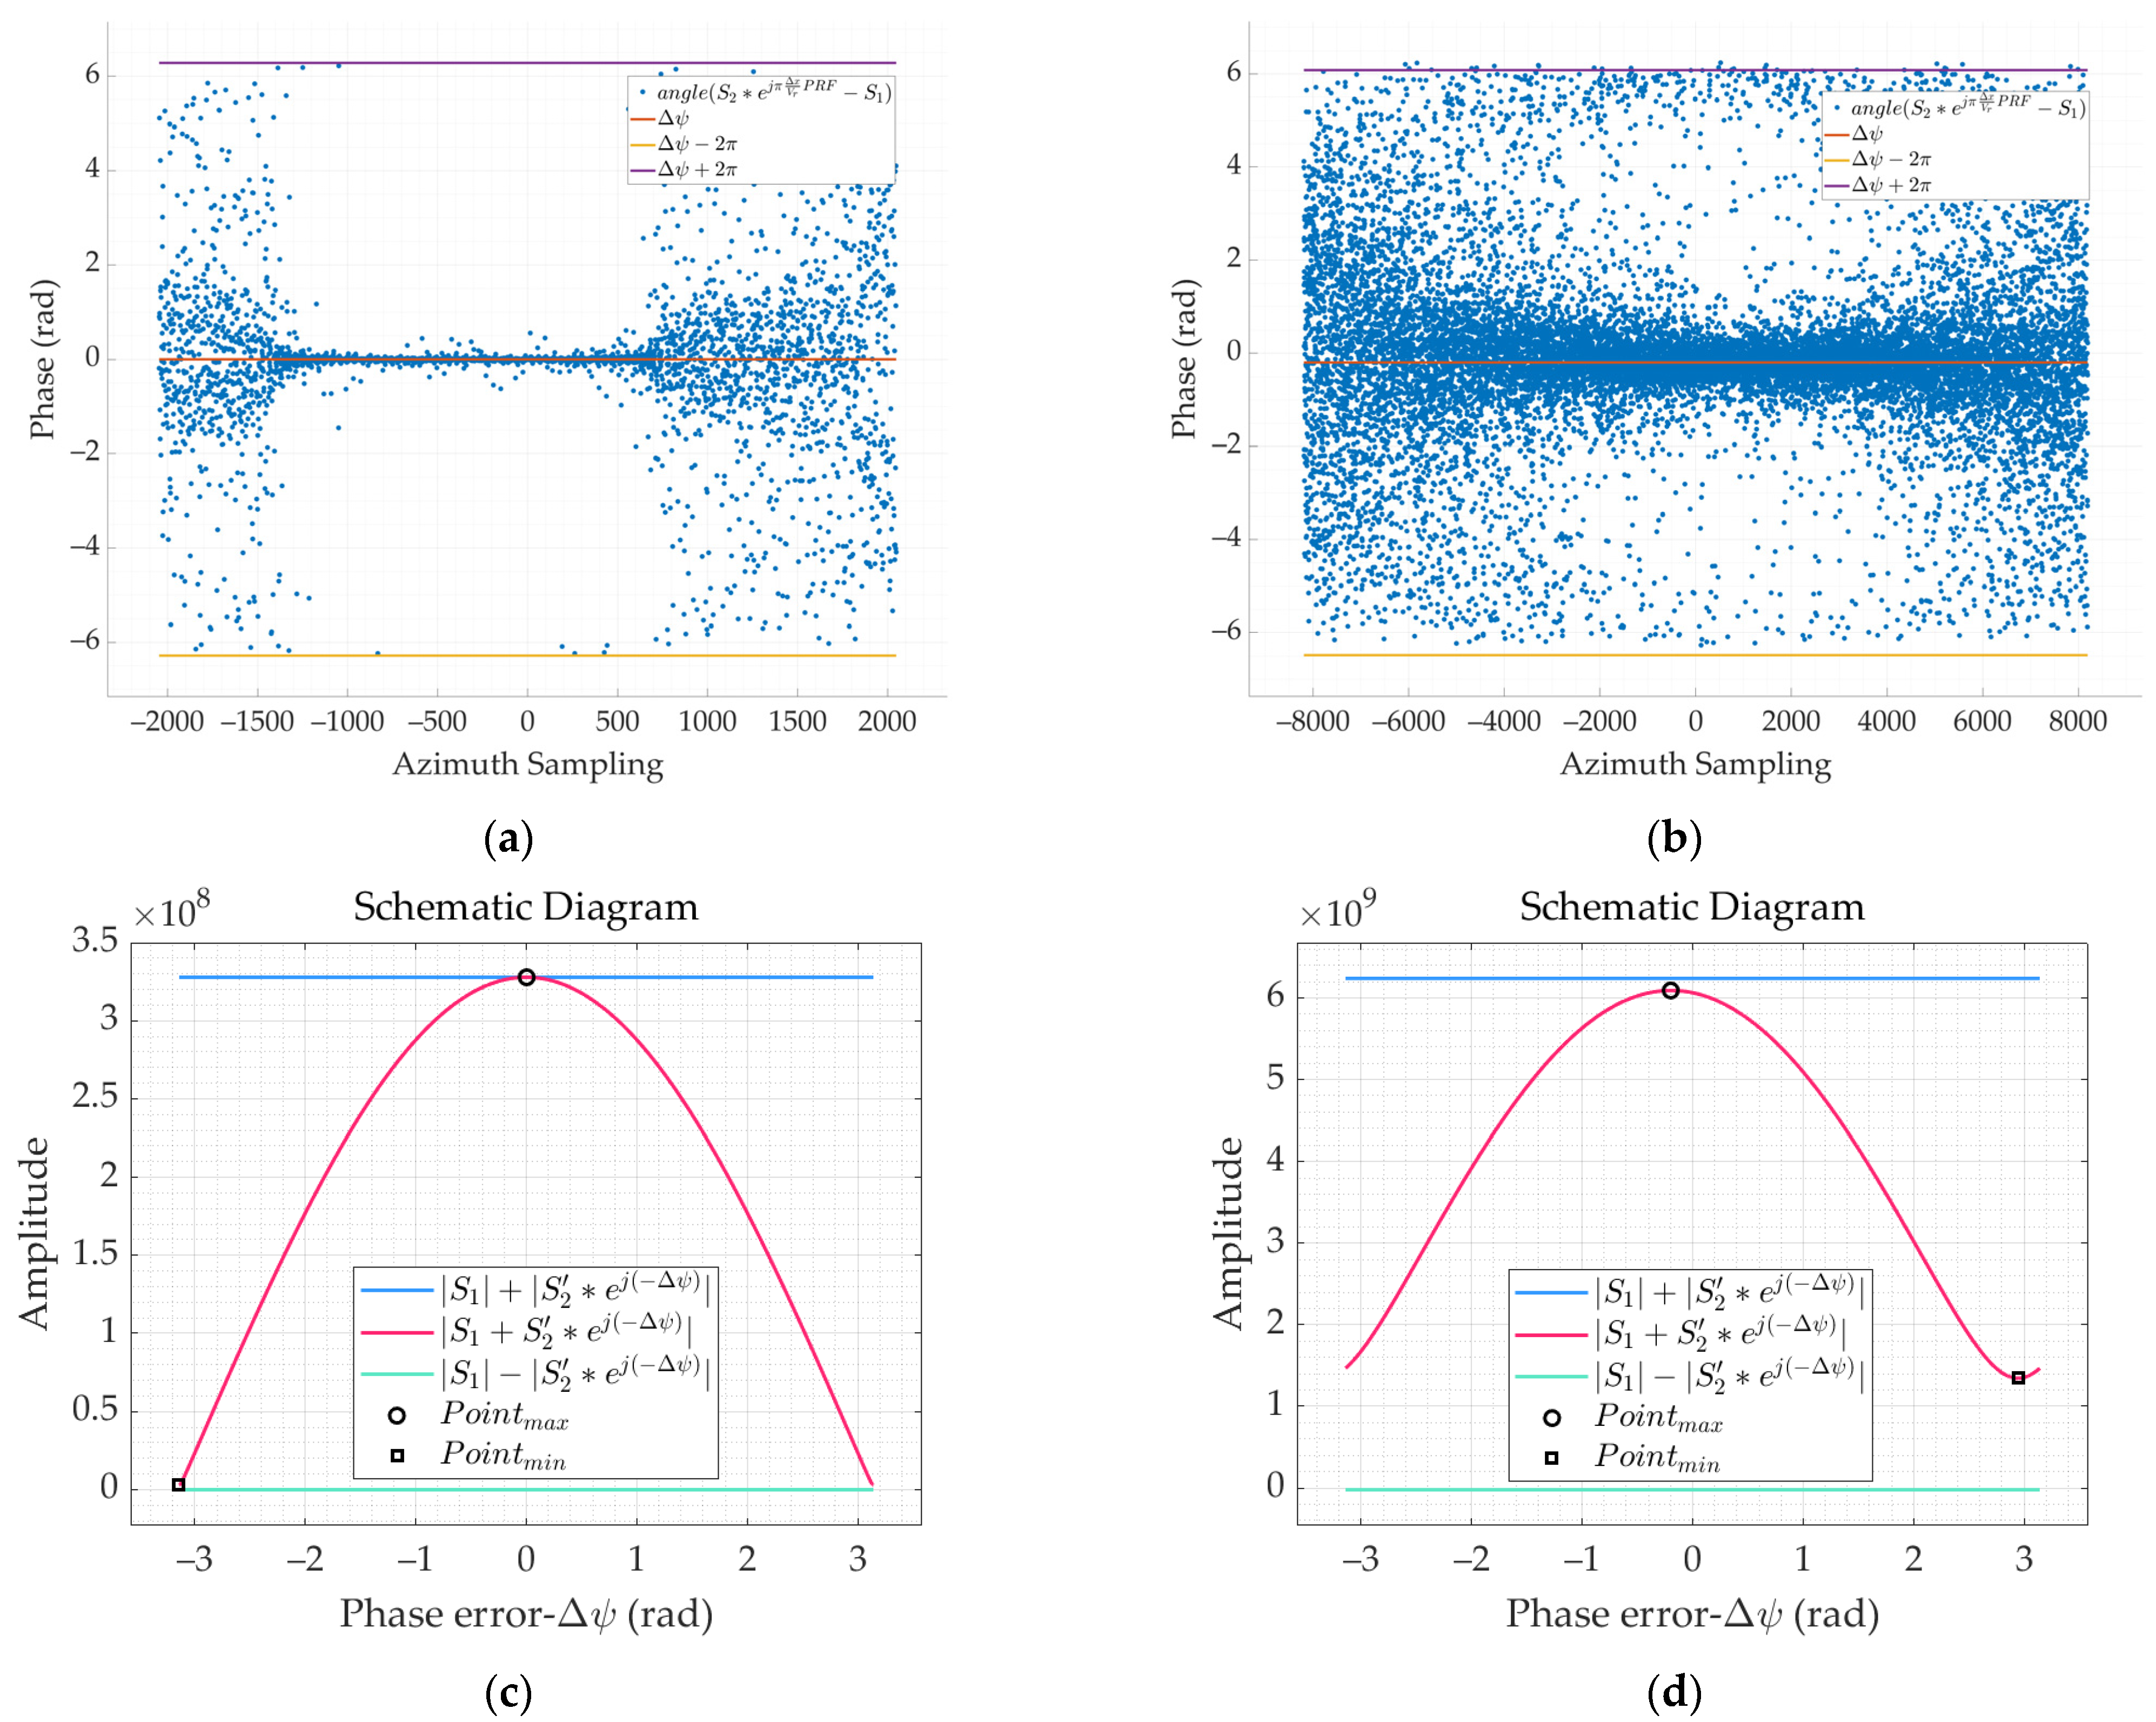
3. Influence of Channel Error on Imaging Performance

The influence of channel amplitude-phase characteristic error and APC position error on imaging is analyzed for the dual-channel model. The simulation parameters are shown in Table 1. By analyzing peak sidelobe ratio (PSLR), integral sidelobe ratio (ISLR), and impulse response width (IRW), the effects of various errors on the system imaging were evaluated quantitatively.
According to the analysis in Section 2, the amplitude and phase errors of the channel can be decomposed into invariant amplitude errors, invariant phase errors, space-variant phase errors, and time-variant phase errors caused by APC position errors. Regarding the parameters in Table 1, various errors were added for the point target simulation.
The following figure shows the azimuth profile of a point-like target obtained without error and by adding 1.3 dB amplitude error, 0.5 rad phase error, and δ x 2 = 0.005   mm , δ y 2 = 0.005   mm , δ z 2 = 0.005   mm APC position error, respectively.
As can be seen from Figure 4b,c, for the azimuth dual-channel system, channel amplitude-phase characteristic errors cause severe false targets in the azimuth direction, and channel phase errors have a more profound impact on imaging quality than amplitude errors. L-band multichannel SAR system has the advantage of long wavelength, and the space–time variation error caused by APC position error is small. Meanwhile, it can be seen from Figure 4d that the effect of time-variant phase error caused by APC position error on imaging is almost negligible. However, in Figure 4e, the space-variant phase error caused by APC position error seriously impacts imaging. Therefore, the channel correction of the L-band multichannel SAR system must focus on the correction of invariant channel errors and space-variant phase errors caused by APC position errors.
Then, the specific effects of invariant amplitude error, invariant phase error, time-variant phase error, and space-variant phase error on imaging quality will be studied through simulation. Three indexes of integral sidelobe ratio (ISLR), peak sidelobe ratio (PSLR), and resolution broadening factor were studied.
The first is the influence of invariant amplitude error on imaging quality. Set the invariant amplitude error of channel 2 relatives to the reference channel to be 0 dB to 2 dB and the step size to be 0.2 dB.
As seen from Figure 5, PSLR and ISLR are linear with invariant amplitude error, and both increase with amplitude error. However, PSLR-R and PSLR-L are different because the amplitude error shifts the filter reconstruction matrix to one side [28], resulting in a different amplitude of the first side lobe on either side of the peak in the final image result.
The second is the influence of channel invariant phase error on imaging quality. Set the invariant phase error of channel 2 relatives to the reference channel to be 0 deg to 40 deg and the step size to be 4 deg.
As can be seen from Figure 6, PSLR and ISLR have a nonlinear relationship with the invariant phase error and increase rapidly with the increase in the invariant phase error. At the same time, PSLR-R and PSLR-L are almost the same because the phase error will cause the same change in the filter reconstruction matrix.
The third is the influence of azimuth APC position error on imaging quality. Set the APC error of channel 2 relatives to the reference channel to be 0 mm to 10 mm and the step size to be 1 mm.
The influence of the azimuth APC position error is small and almost negligible. The last is the influence of range APC position error on imaging quality. Set the APC position error of channel 2 relatives to the reference channel to be δ y 2 = 0   mm to 10   mm and δ z 2 = 0   mm to 10 mm , respectively, and the step size to be 2 mm.
The effect of range APC position error on image quality is consistent with the invariant channel phase error. In general, the influence of channel error on image mainly includes two aspects: the appearance of ghost targets on both sides of real targets along the azimuth direction (as shown in Figure 4) and defocusing of real targets (as shown in Figure 5, Figure 6, Figure 7 and Figure 8). The reason is that with the existence of channel errors, the ambiguous components are not suppressed completely and the full Doppler spectrum cannot be reconstructed well. As can be seen from the above figures, the PSLR and ISLR are easily affected by phase errors, but the IRW does not change significantly. This is because channel errors lead to imaging defocusing. Among the four errors, constant phase error and space-variant phase error caused by APC position error have the most severe effect on imaging quality.

4. LT-1 SAR Performance Analysis

As shown in Figure 9, the adequate aperture size of the LT-1 antenna array is 9.8 m × 3.4 m (azimuth × range). In order to realize HRWS imaging, AMC technology is adopted. Namely, the azimuth is divided into two independent sub-apertures on the antenna +X wing and −X wing, respectively [31]. Due to the DRA, the LT-1 strip map mode can achieve approximately 3 m azimuth resolution and a 50km swath imaging area with a PRF of less than 2000 Hz. It is difficult to achieve such high spatial resolution for traditional strip map SAR using the same PRF.

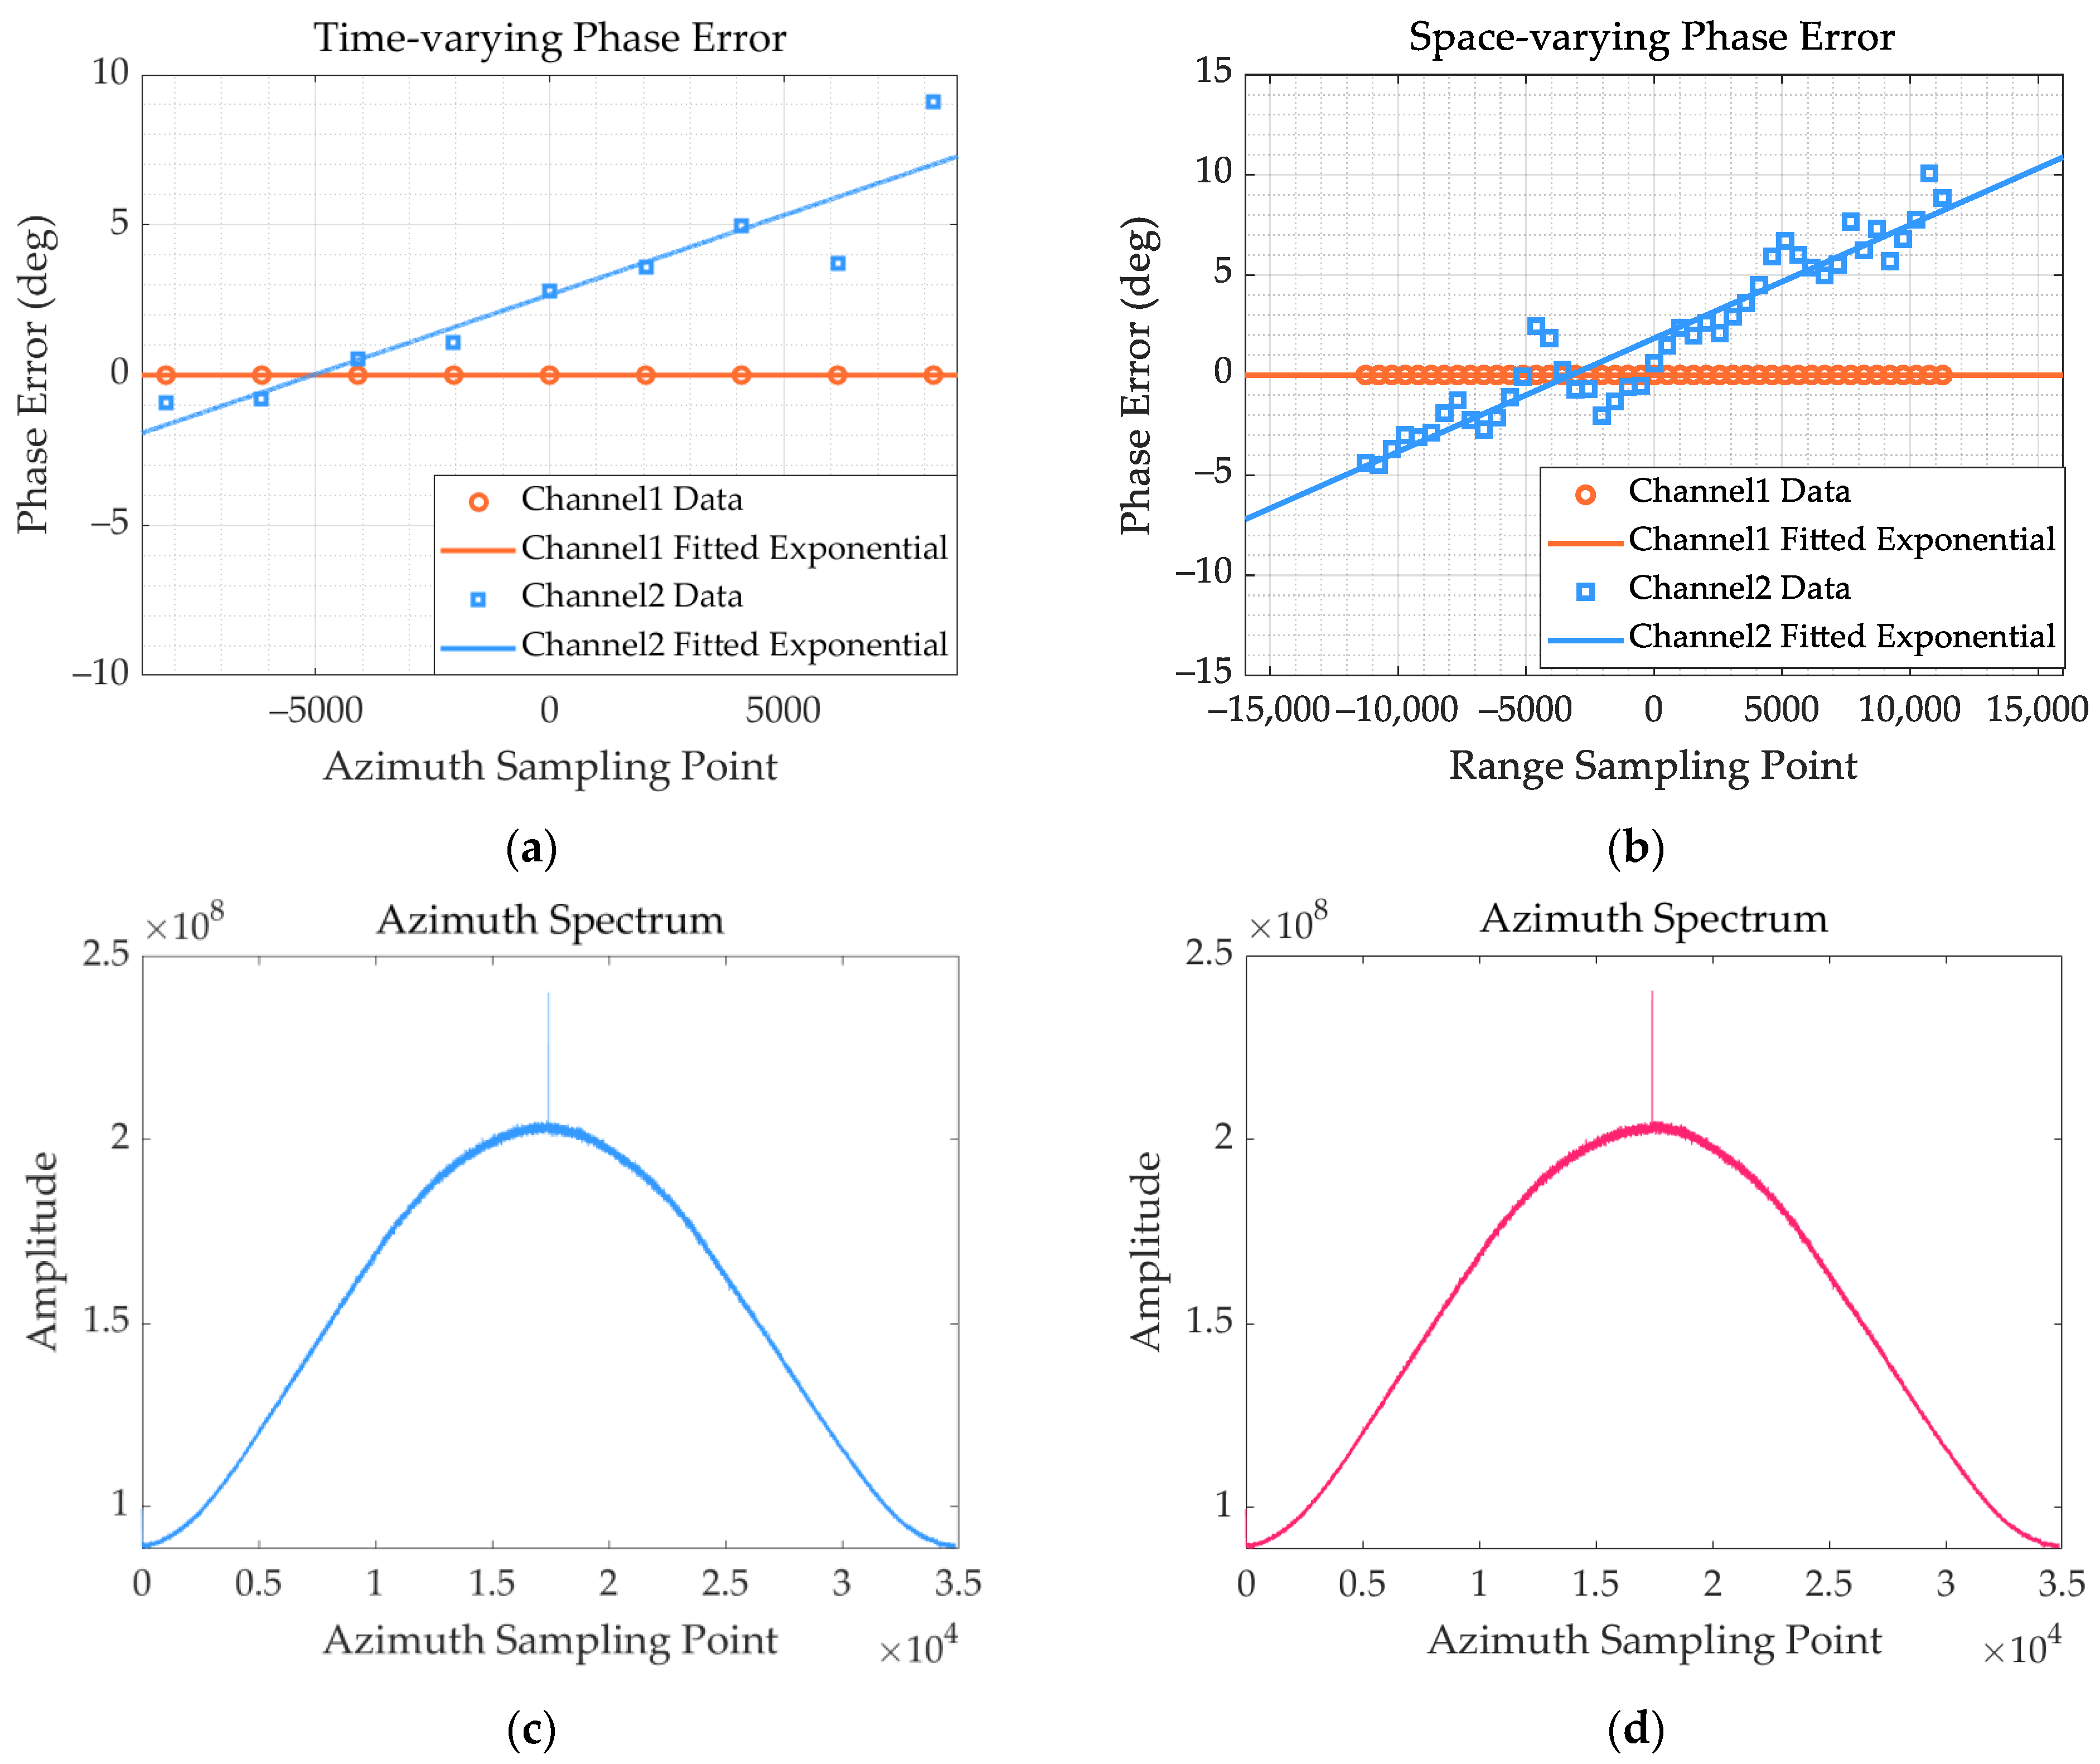
4.1. Consistency Calibration Method for Channel Error

This paper proposes a novel phase error estimation method based on the MLNS method to evaluate the phase error of LT-1 SAR system DRA mode. It has fast calculation speed, high estimation accuracy, and strong estimation stability. Moreover, according to the estimation characteristics of this method, many blocks can be divided in the range direction without adding a calculation amount, so the space-variation phase error caused by APC position error can be estimated.
According to the subadditivity of normed linear spaces [32], two complex numbers, a and b , satisfy the following triangular inequalities:
| a | | b | | a ± b | | a | + | b |
If, and only if, the angles of the complex numbers a and b are the same, the equal can be taken on both sides of the above equation, and the absolute values of the sum of two complex numbers can obtain the maximum value. For a dual-channel system, the echo signals of both channels are complex and can be expressed as a set of normed linear spaces. The SAR system’s time domain echo signal phase satisfies a random distribution and needs to be transformed into a two-dimensional frequency domain. In order to estimate the channel phase error, based on the feature selection characteristics of the L1 norm, an L1 norm model of the sum of frequency domain echo signals of dual channels SAR system can be established as
F ( Δ φ ) = i = 1 N | S 1 ( f η , i ) + exp { Δ φ } S 2 ( f η , i ) |
S 1 ( f η , i ) and S 2 ( f η , i ) are aliased spectra obtained by performing azimuth Fast Fourier Transform (FFT) on s 1 ( η ) and s 2 ( η ) , respectively, where f η [ - PRF / 2 , PRF / 2 ] . According to spectrum reconstruction theory [3], the aliased spectrum of each channel can be represented as the product of a pre-filter matrix H [28], and the original aliased-free frequency domain signal
[ S 1 ( f η ) S 2 ( f η ) ] = H [ S 0 ( f η , 1 ) S 0 ( f η , 2 ) ] = [ exp { j π Δ x 1 V s f η , 1 } exp { j π Δ x 1 V s f η , 2 } exp { j π Δ x 2 V s f η , 1 } exp { j π Δ x 2 V s f η , 2 } ] [ S 0 ( f η , 1 ) S 0 ( f η , 2 ) ]
S 0 ( f η , 1 ) and S 0 ( f η , 2 ) are two sub-band spectra of the complete aliased-free spectrum, where f η , i [ - PRF , 0 ] + ( i 1 ) PRF . According to Equation (21), S 1 ( f η , i ) and S 2 ( f η , i ) can be expressed as
S 1 ( f η , i ) = S ( f η , 1 , i ) + S ( f η , 2 , i )
S 2 ( f η , i ) = exp { j π d a z , r x V s f η , 1 , i } S ( f η , 1 , i ) + exp { j π d a z , r x V s f η , 2 , i } S ( f η , 2 , i )   = exp { j π d a z , r x V s f η , 1 , i } ( S ( f η , 1 , i ) + exp { j π d a z , r x V s PRF } S ( f η , 2 , i ) )
Compensate one phase term exp { j π d a z , r x f η , 1 , i / V s } for Equation (23) to obtain its simplified form:
S 2 ( f η , i ) = S ( f η , 1 , i ) + exp { j π d a z , r x V s PRF } S ( f η , 2 , i )
After compensating for the channel phase error for channel 2, Equation (20) can be expressed as
F ( Δ φ Δ φ ^ ) = i = 1 N | S 1 ( f η , i ) + exp { j Δ φ ^ } exp { j Δ φ } S 2 ( f η , i ) |   i = 1 N | S 1 ( f η , i ) | + i = 1 N | exp { j Δ φ ^ } exp { j Δ φ } S 2 ( f η , i ) |
Fortunately, in the actual operation process, the phase difference between S 1 ( f η , i ) and S 2 ( f η , i ) is symmetrically distributed with respect to the channel phase error. According to the parameters in Table 1, we verify it through simulation and measured data. As shown in Figure 10a,b, the differences between argument angles of S 1 ( f η , i ) and S 2 ( f η , i ) concentrate near the phase error and distribute symmetrically along the phase error. As can be seen from Figure 10c,d, when compensating for channel errors, F ( Δ φ Δ φ ^ ) has a maximum value. When compensating for an error inversely related to the phase error, F ( Δ φ Δ φ ^ ) has a minimum value, and the maximum and minimum results are consistent with Equation (25).
According to the subadditivity of normed linear space, when the estimated phase error and the channel error are the same, there is a maximum value for F ( Δ φ Δ φ ^ ) . When the estimated phase and channel errors are inverted, there is a minimum value for F ( Δ φ Δ φ ^ ) . Therefore, the MLNS optimization model is established as
Δ φ ^ = arg max Δ φ ^ { F ( Δ φ Δ φ ^ ) } s . t . | Δ φ ^ | π
To facilitate the use of optimization algorithms in MSSBN, Equation (26) is rewritten as
Δ φ ^ = arg min Δ φ ^ { 1 F ( Δ φ Δ φ ^ ) } s . t . | Δ φ ^ | π
Compared to the MSSBN method, the MLNS method can directly estimate channel phase error using two-dimensional frequency domain echo signals and has higher computational efficiency with consistent accuracy.

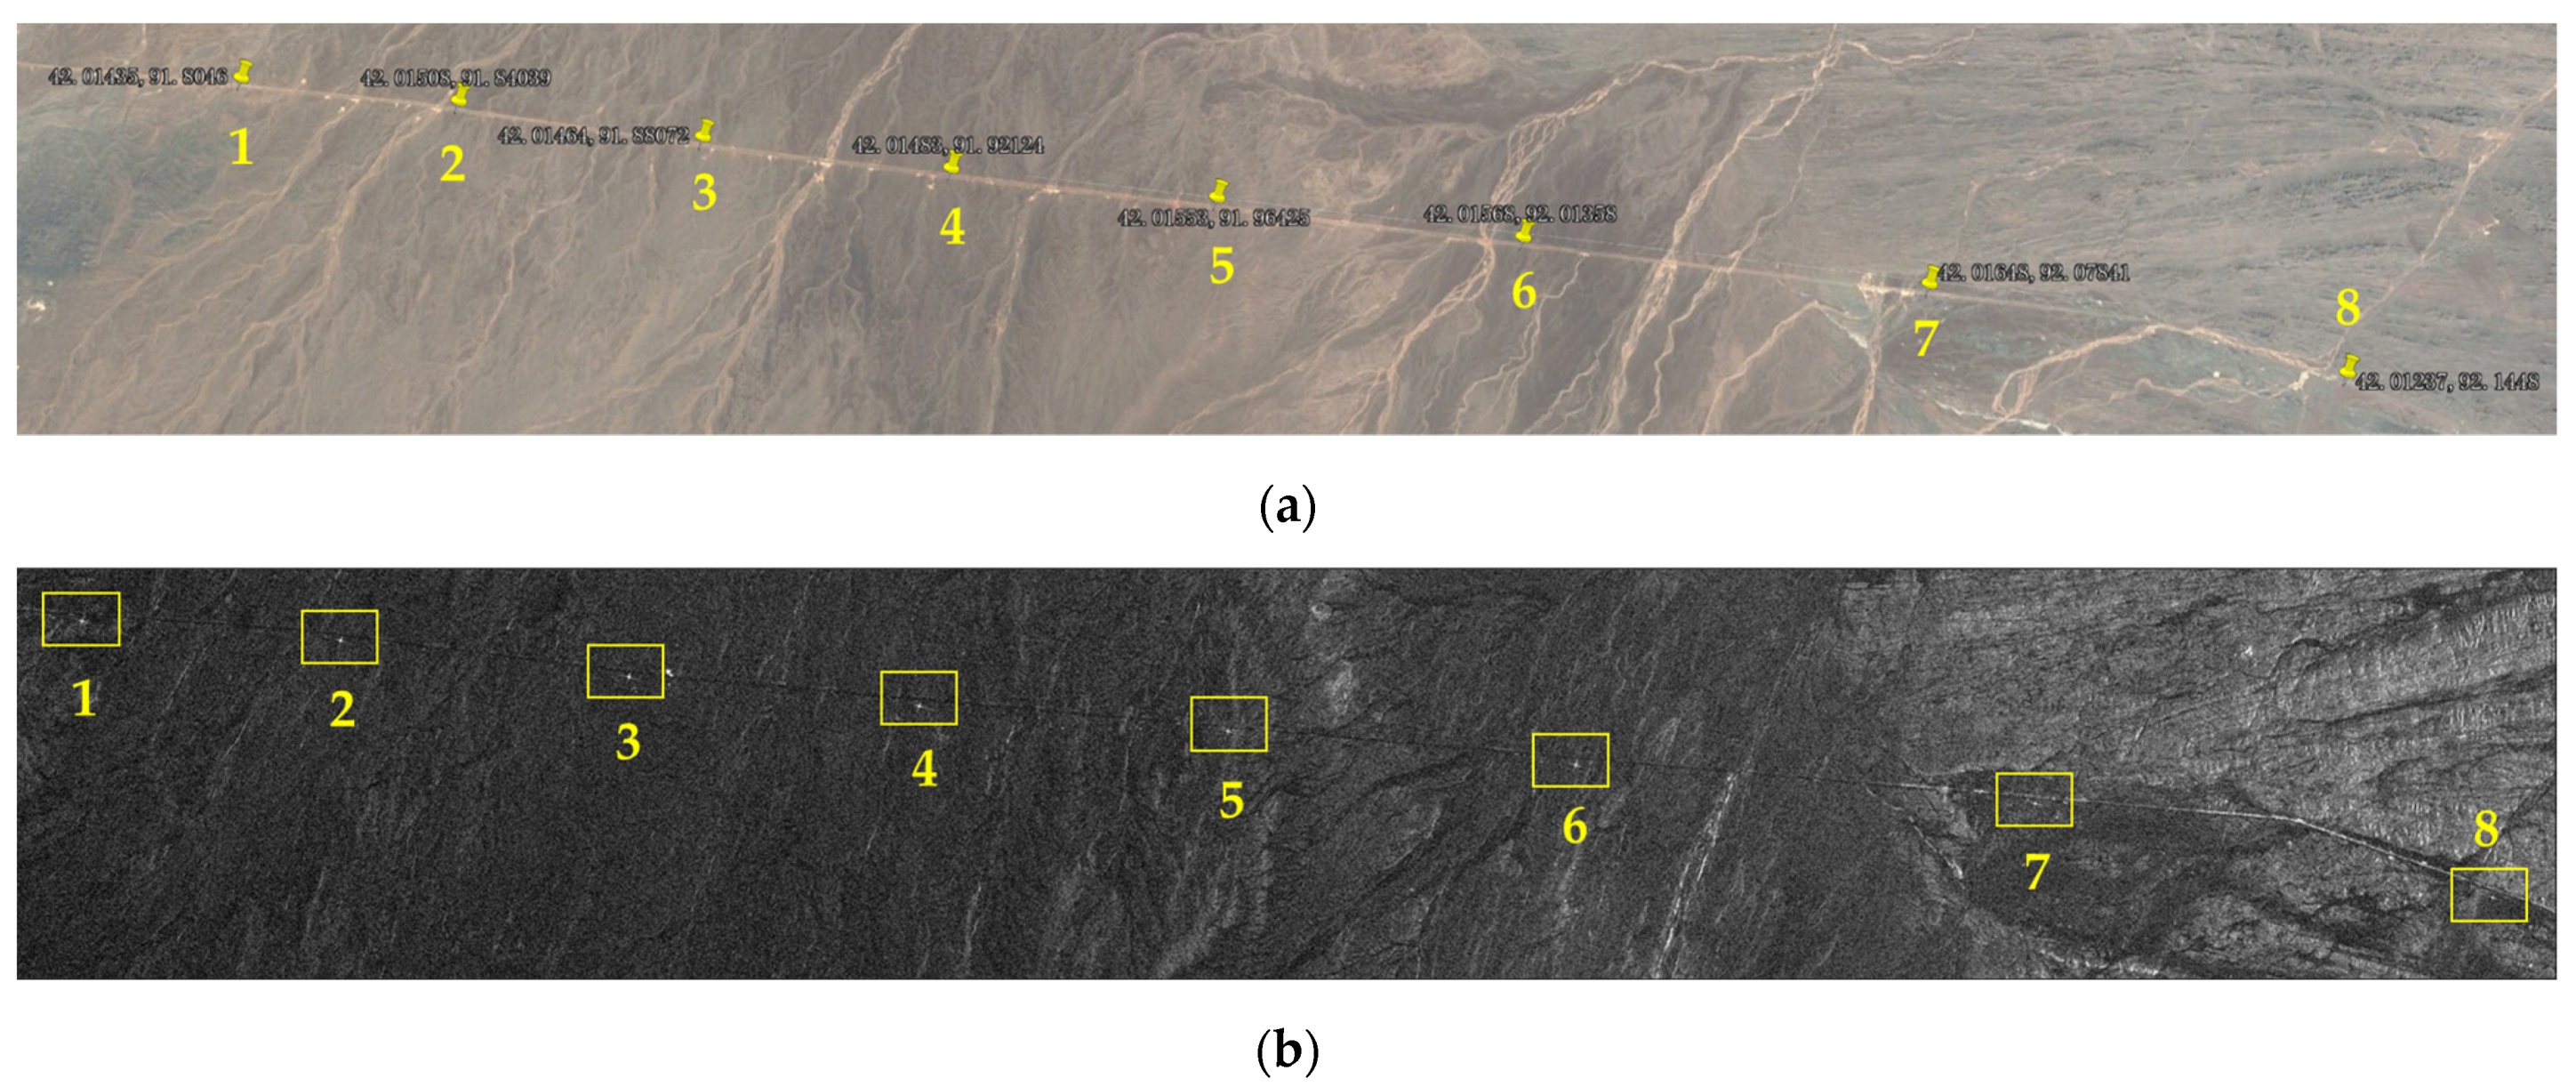
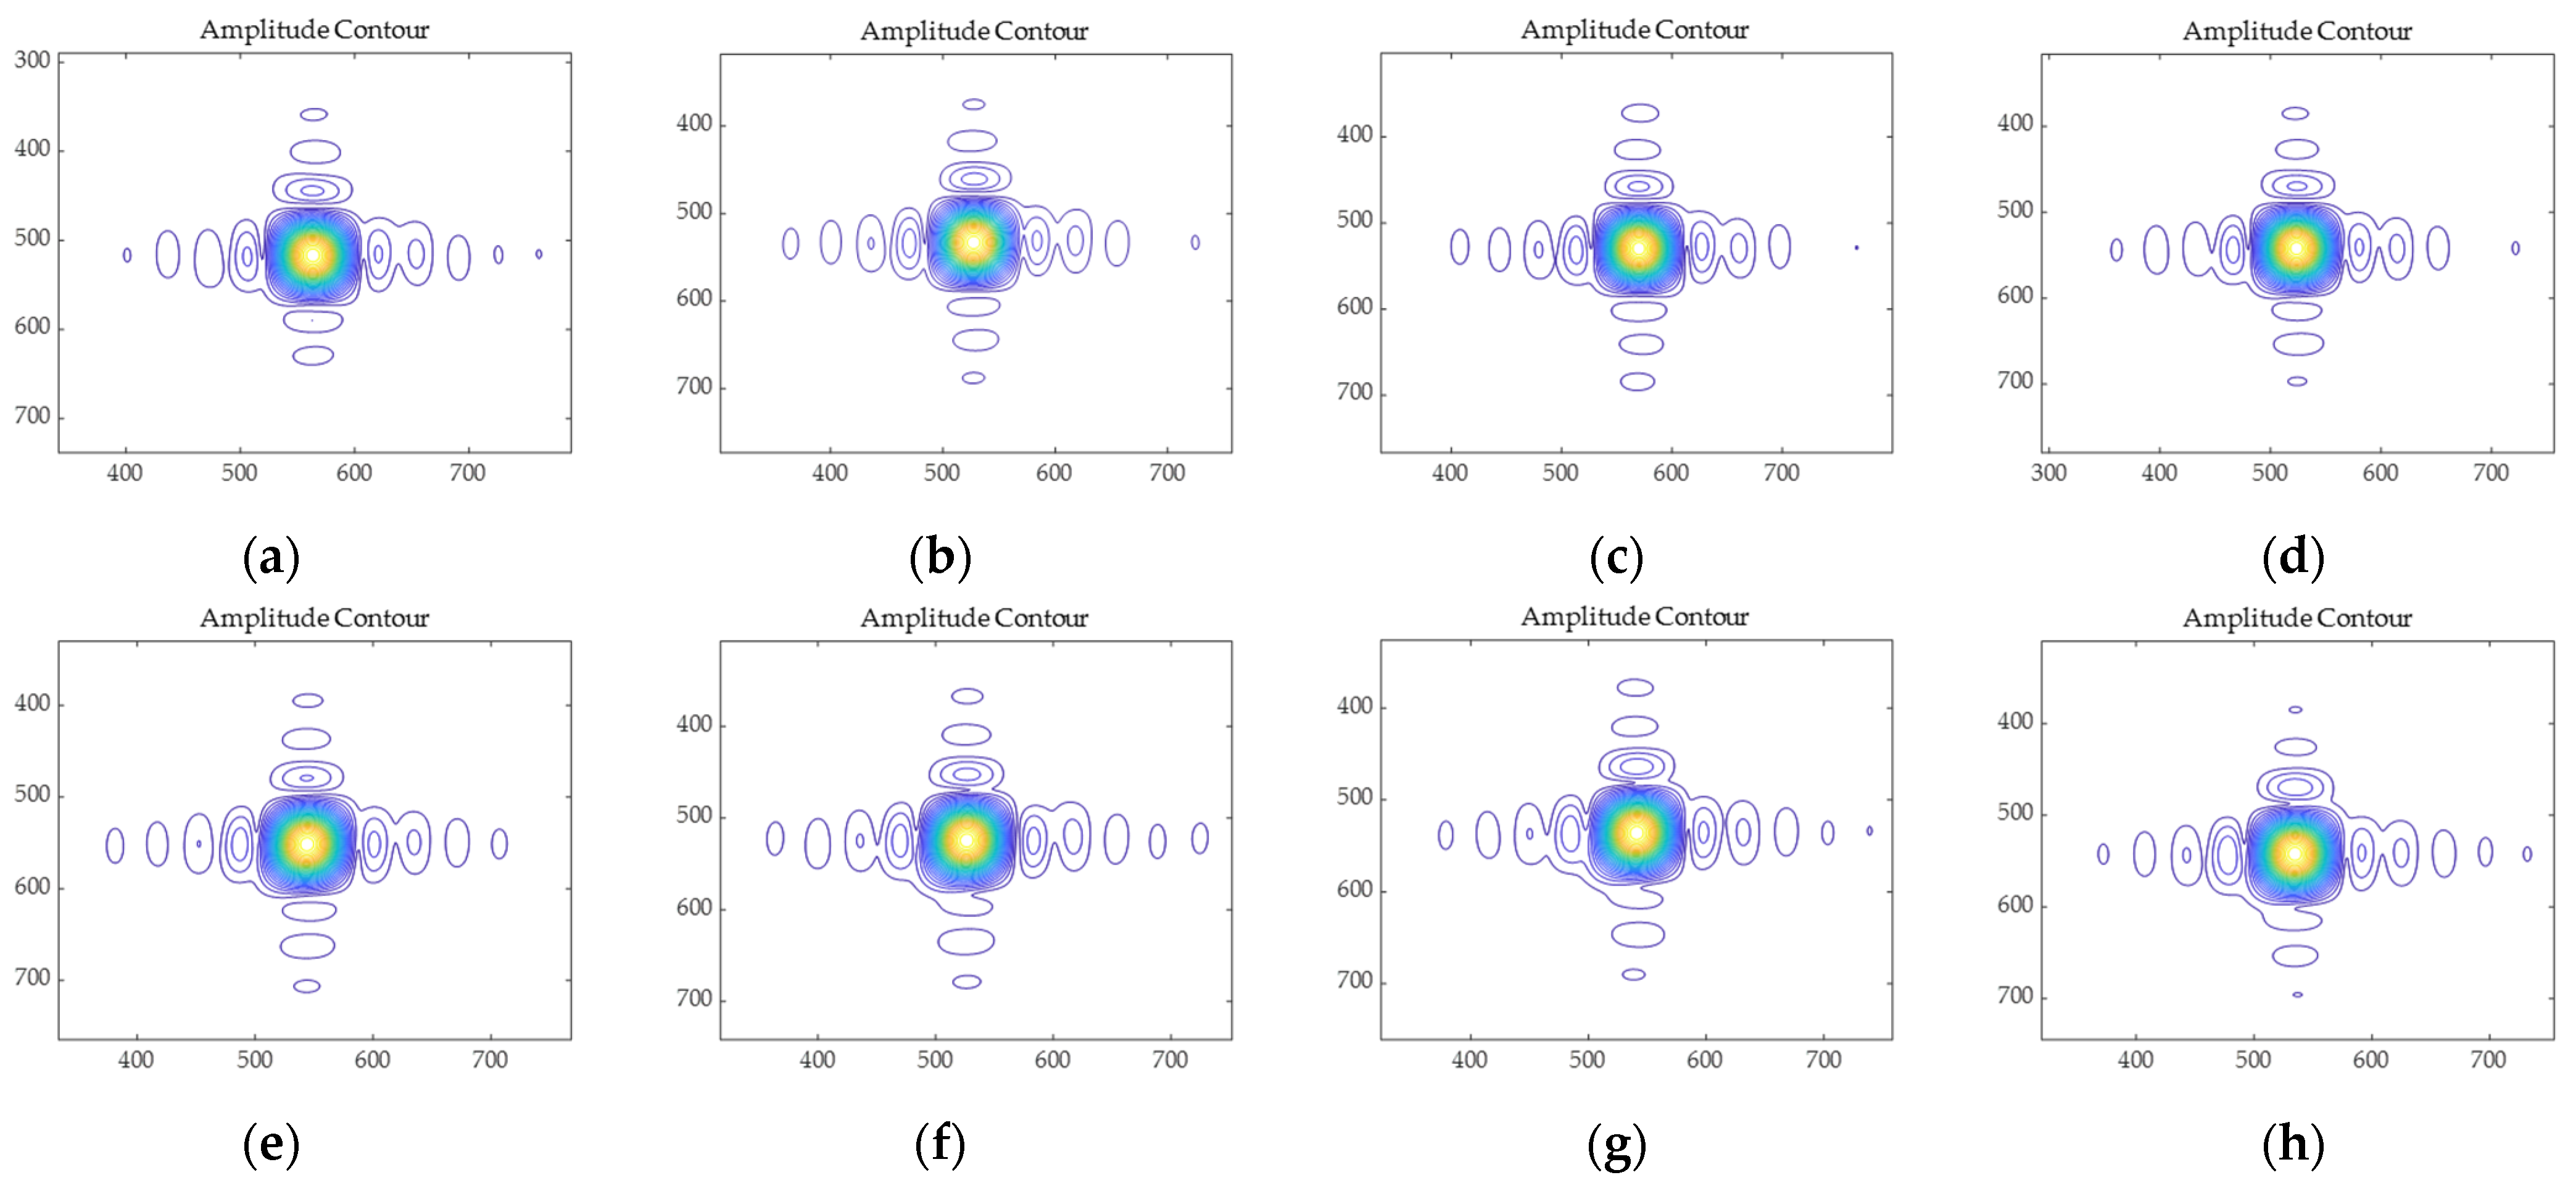
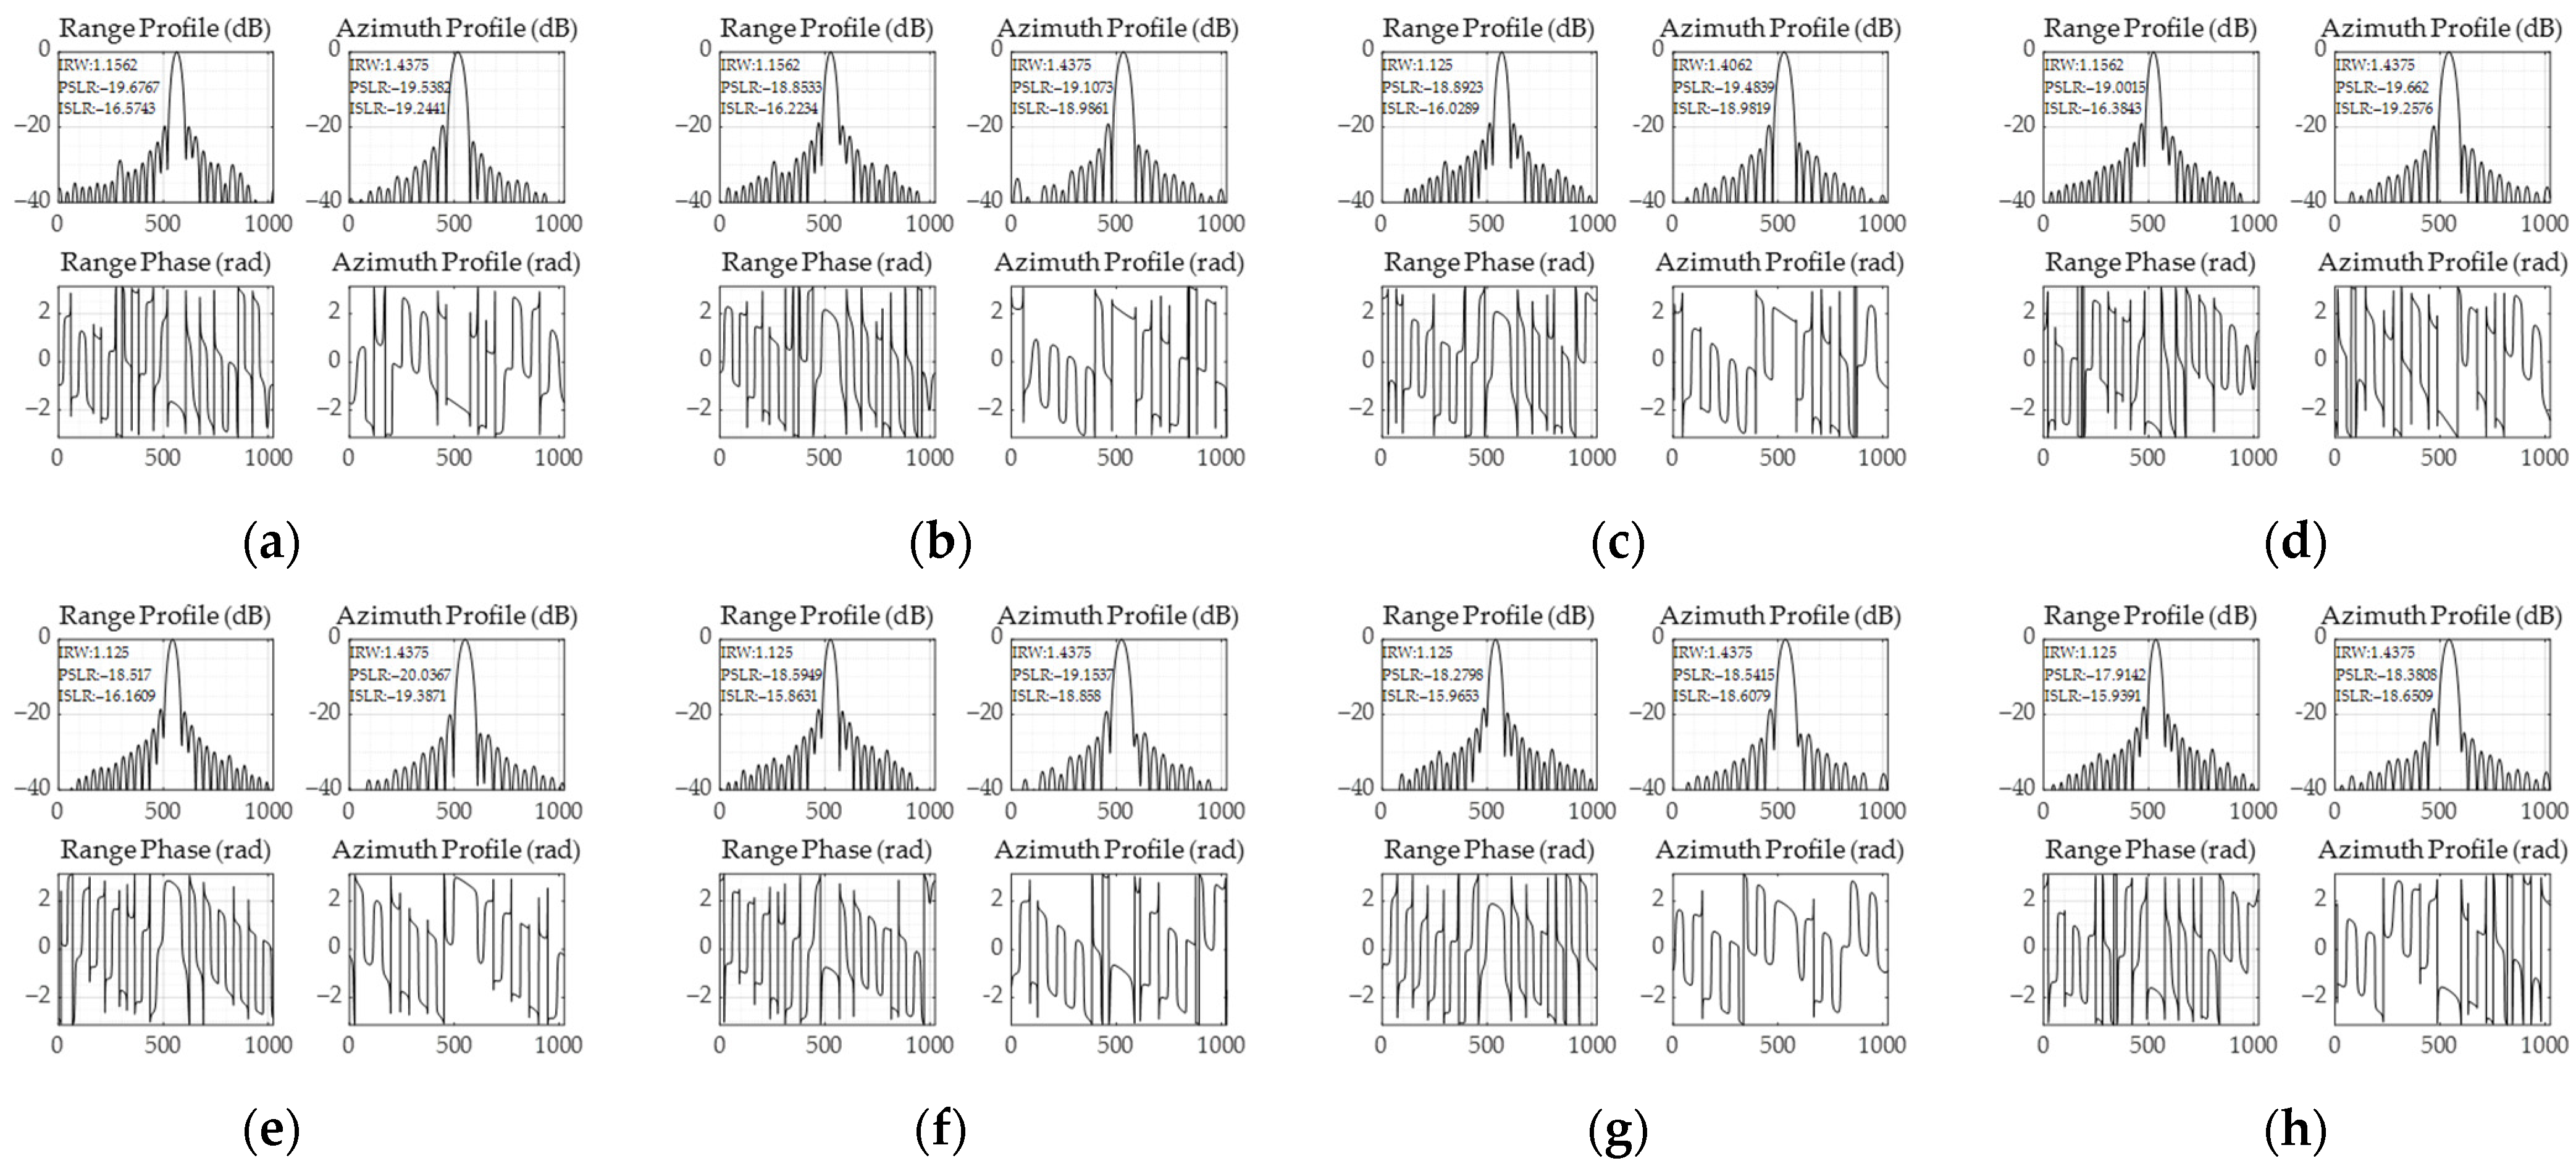
4.2. Calibration Point Imaging Results

SAR resolution and sidelobe ratios are essential parameters for quantifying the quality of focused SAR images. A point-like target analysis from a corner reflector’s two-dimensional impulse response function can determine them. The peak-to-sidelobe ratio (PSLR) defines the ratio between the prominent lobe power peak and the highest sidelobe power peak. It represents the ability of a SAR system to identify a weak target from a nearby strong one and gives information about the system’s sensitivity. The integrated sidelobe ratio (ISLR) is the ratio of the energy in the main lobe to the total energy in all sidelobes. It represents the ability of the SAR system to detect weak targets in the neighborhood of bright targets. Therefore, the imaging capability of LT-1 will be evaluated first by imaging the calibration point.
As shown in Figure 11a, this paper takes the Hami South Gobi area in Xinjiang as the research area, and its geographic location is 90°15′E–93°35′E and 40°05′–42°25′N. The study area has a typical temperate continental arid climate with low soil humidity and no vegetation coverage [33]. It is an ideal natural calibration field for microwave radiation calibration. LT-1 acquired the selected data on July 7 in the DRA mode. The system parameters and coordinates of the point-like target experiment are shown in Table 2 and Table 3. The incident angle was 39°, and the initial resolution of the SAR imagery was 3 m.
According to the amplitude error estimation, the amplitude error of channel 2 compared with the reference channel is 0.316 dB, which is within the internal calibration precision (0.4 dB) of LT-1. Figure 12a,b show the azimuth time-varying phase error and range space-varying phase error estimated by the MSSBN channel error estimation method. Compared with the reference channel, the azimuth time-varying phase error and range space-varying error are linearly related to the sampling interval, and the absolute value of the phase error relative to the reference channel is within 10 deg. As seen in Figure 6, the phase error within 10 degrees has a minimal impact on the imaging quality and can usually be ignored. This result is consistent with the azimuth spectrum in Figure 12c,d. When there is a significant phase error for uniform land scenes, there is a significant jump in the reconstructed spectral sub-bands at the junction. Figure 12c,d show that the reconstructed spectrum with phase error and the reconstructed spectrum after compensating for phase error are both very smooth. Although the phase error in this scene has significant time–space varying due to other factors, it does not affect the spectrum reconstruction results.
After channel error correction and two-channel signal reconstruction, the calibration field scene was imaged. As can be seen from Figure 13 and Figure 14, calibration points are well-focused. Figure 14 shows the analysis results of range and azimuth slices of calibration points. It can be seen from the figure that ISLR indexes of all calibration points are less than −16 dB, satisfying the system design indexes of LT-1 (ISLR ≤ −13 dB). Furthermore, the PSLR of all calibration points is close to the system design indexes of LT-1 (PSLR ≤ −20 dB). It can be further reduced later by adding Windows.

4.3. Scenarios Imaging Results

Then, DAR echo data of different scenarios will be processed in this paper. The estimation of channel errors, azimuth reconstruction spectrum, imaging results, and AASR evaluated the performance of the LT-1 DRA imaging mode.

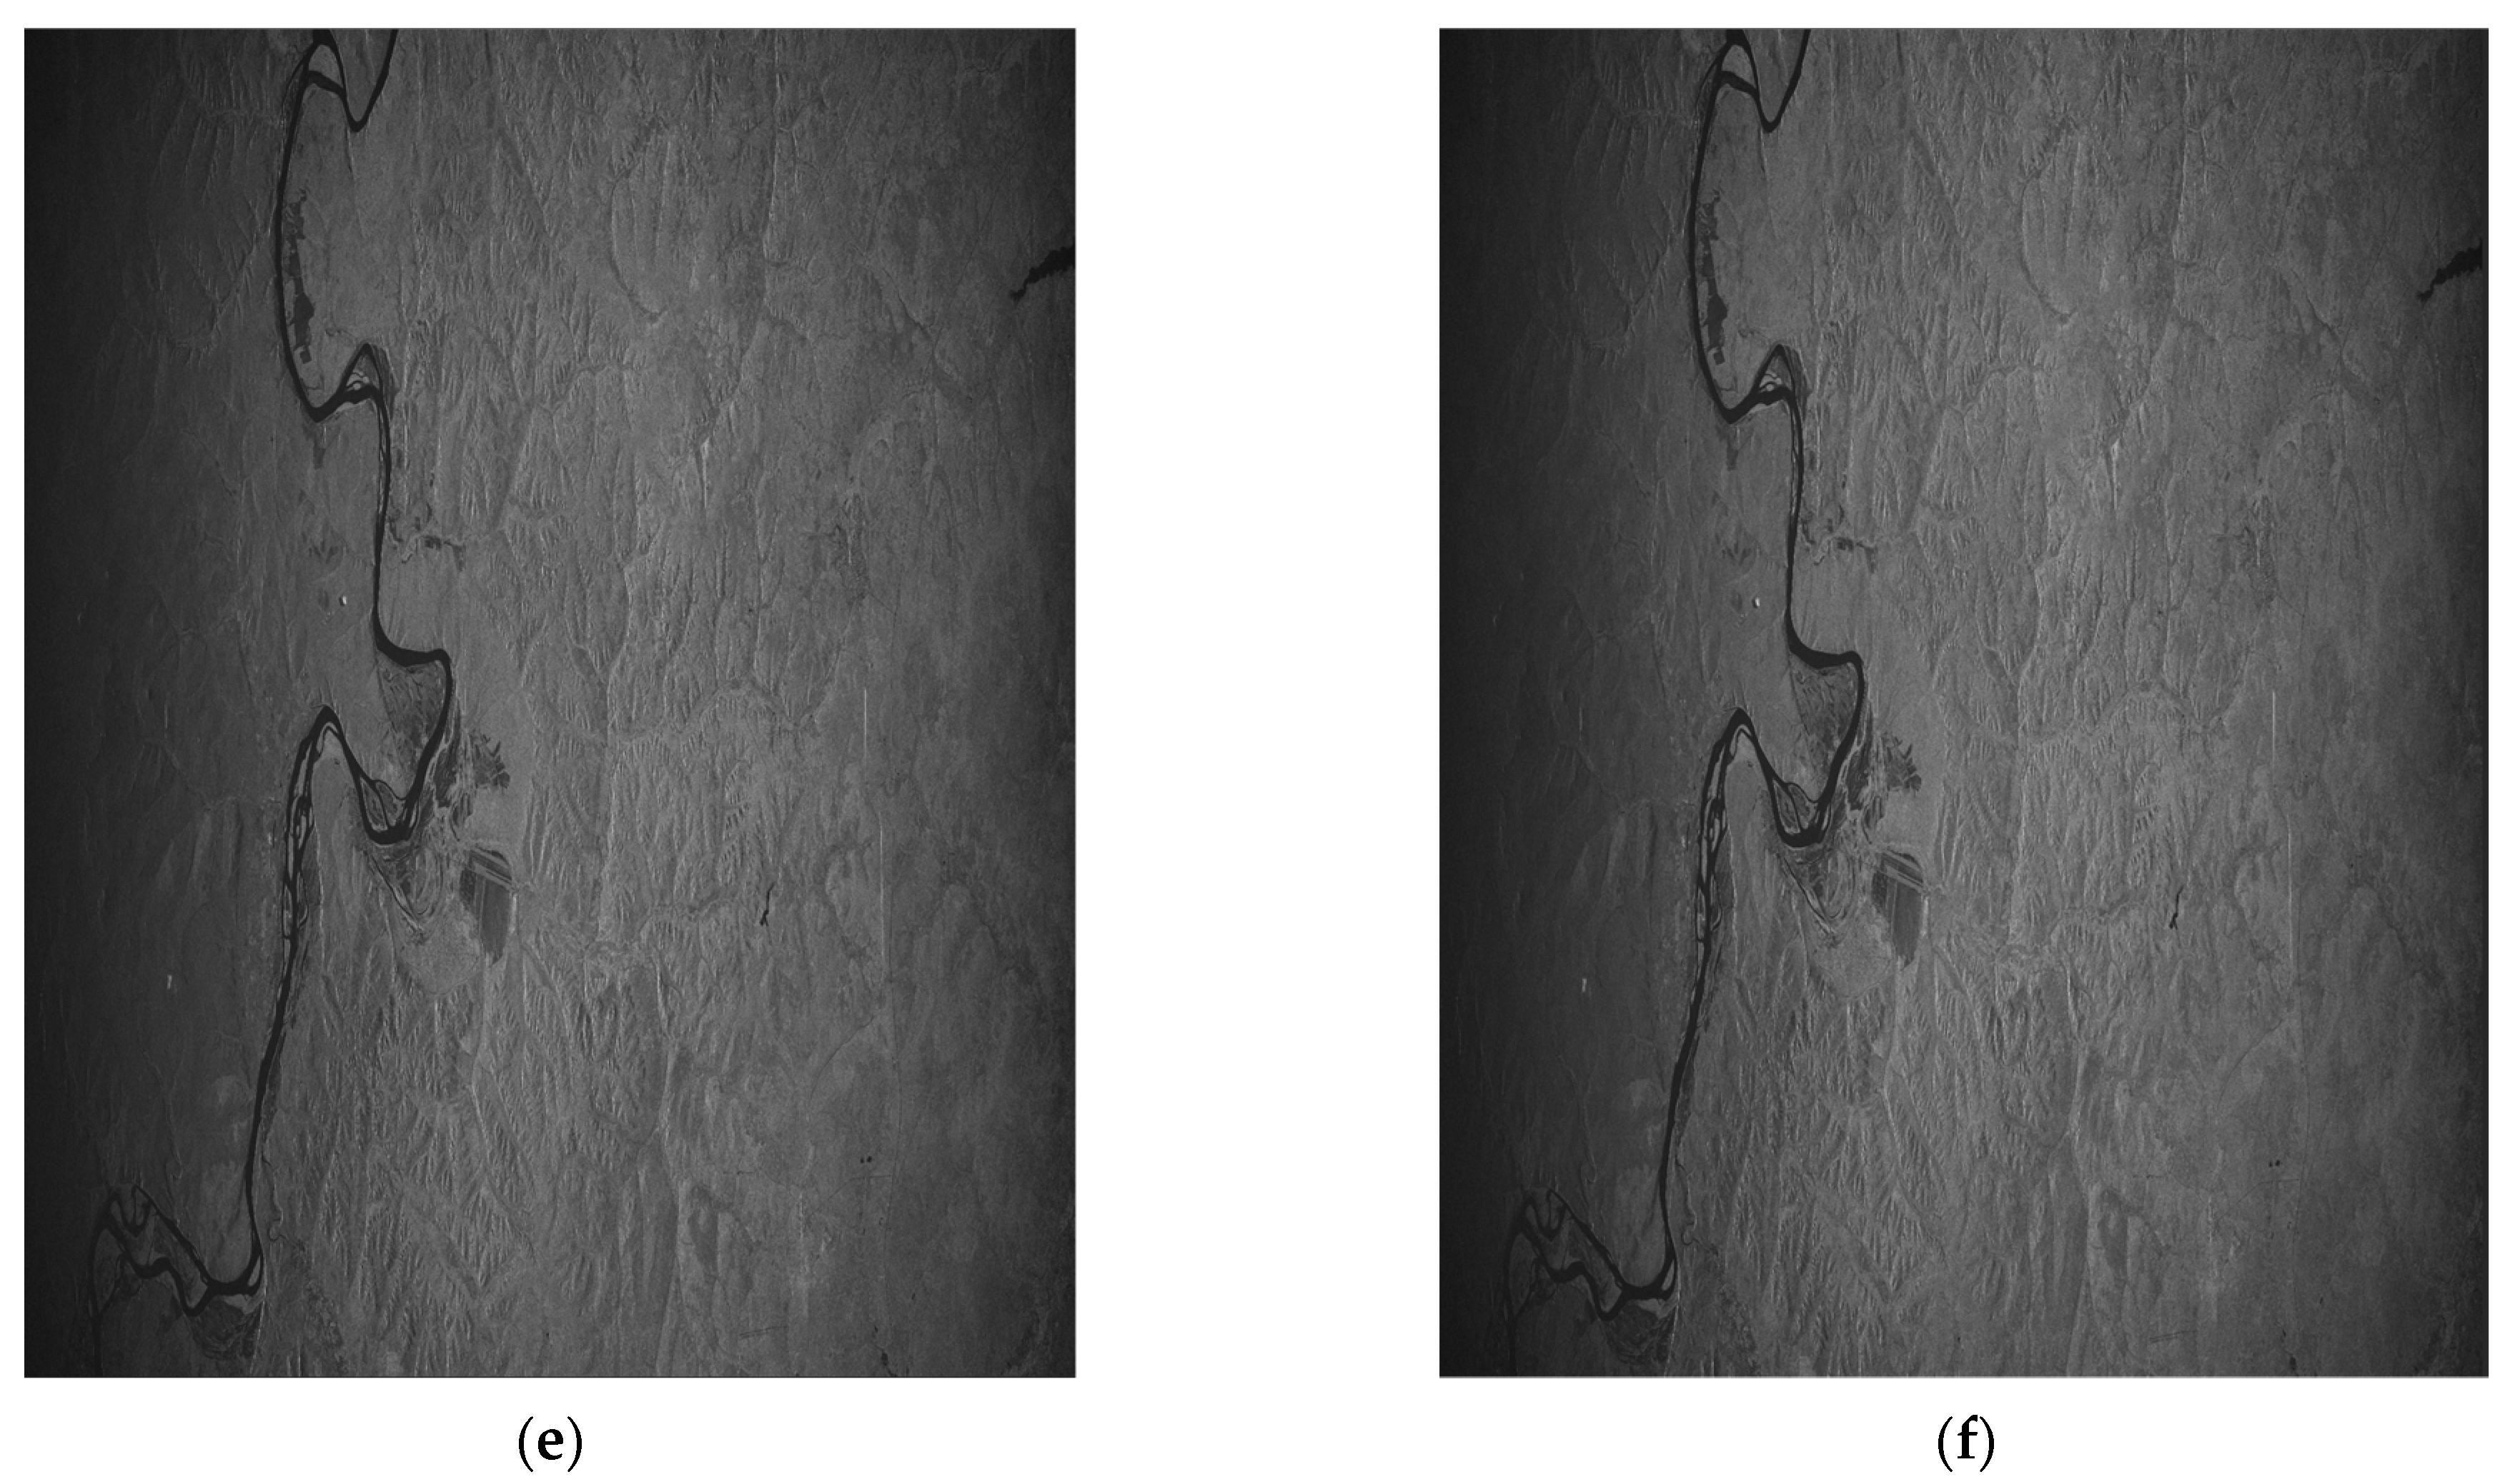
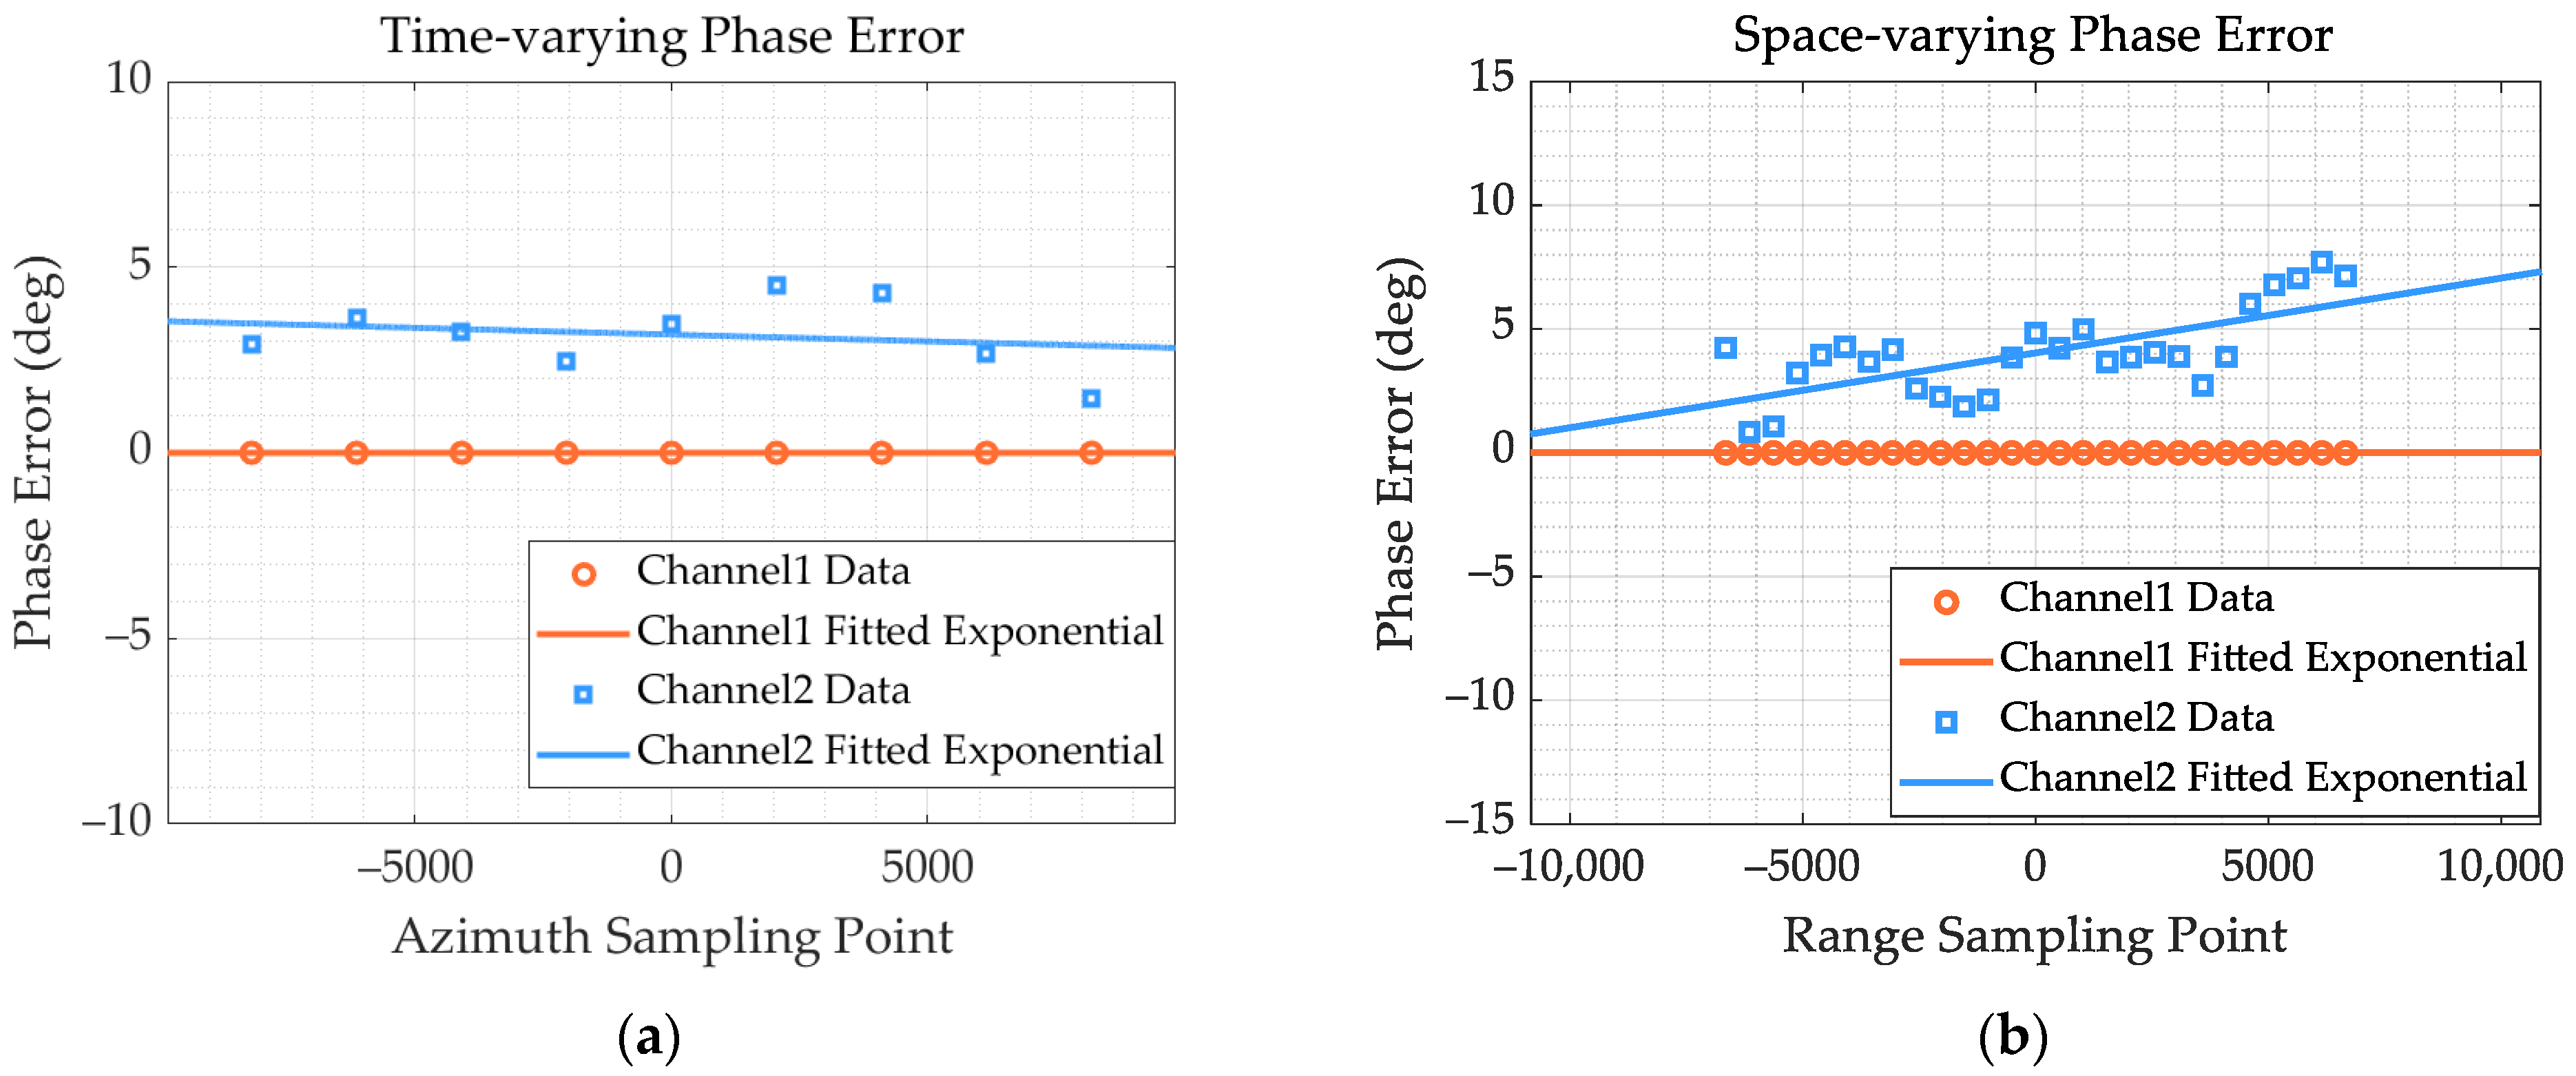
4.3.1. Wilderness Scenarios

The data collected by LT-1 on 19 October 2022 were processed. Other imaging parameters were consistent with Table 2 except that the R 0 was 692 km. The estimated amplitude error of this scenario is 0.3677 dB, which meets the design requirements. It can be seen from Figure 15a,b that the phase error of space–time variation is very tiny, and the phase error is approximately a constant error within 10 deg. Therefore, the azimuth spectrum is recovered ideally after channel error correction in Figure 15c,d. As can be seen from the imaging results in Figure 15e,f, the channel error within 10 degrees has very little influence on the imaging quality.

4.3.2. City Scenarios

The city scenarios data collected by LT-1 on 29 August 2022 were processed. Other imaging parameters were consistent with Table 2 except that the R 0 was 692 km and V s was 7640 m/s, and the estimated amplitude error of this scenario is 0.3469 dB.
The LT-1 system always maintains good channel error control ability during operation. From Figure 16a,b, it can be seen that the time-varying phase error of the channel is controlled within 5 deg, and the space-varying error is controlled within 10 deg. It can be seen from the reconstructed spectrum that the reconstructed spectrum without channel error correction is consistent with the reconstructed spectrum after channel error correction. The imaging results in Figure 16e,f show that there is no apparent azimuth ambiguity in the images.

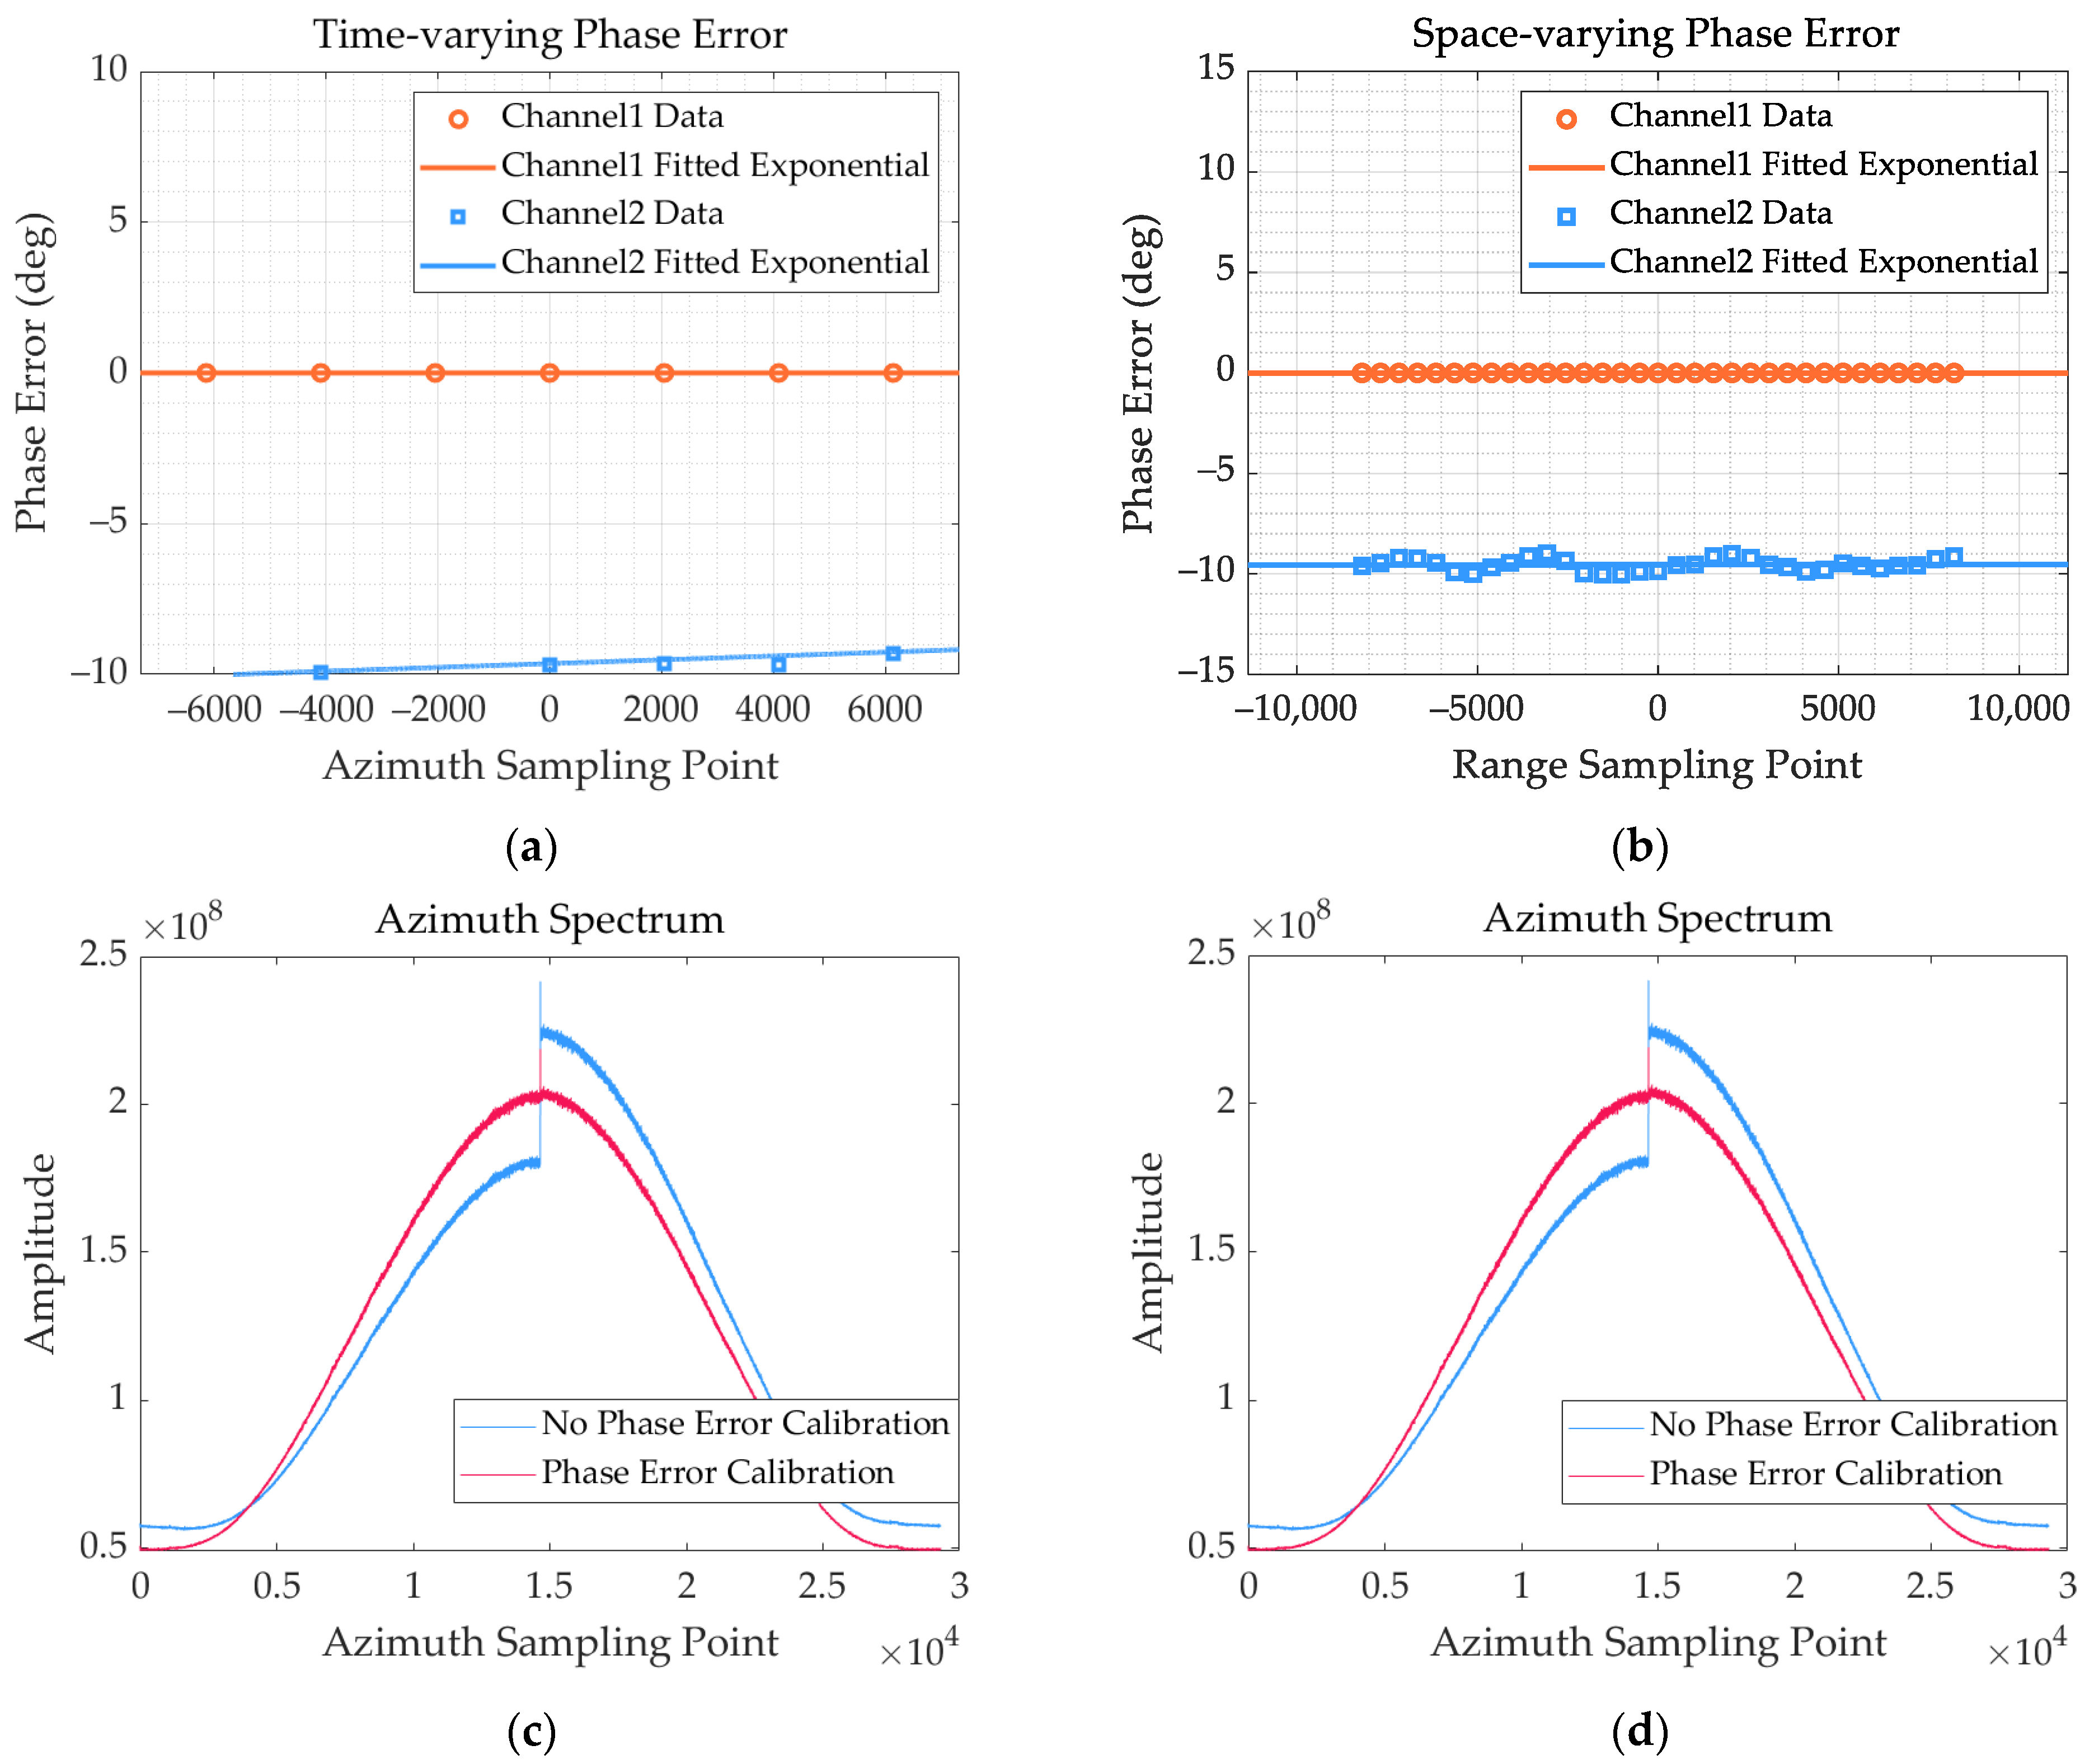
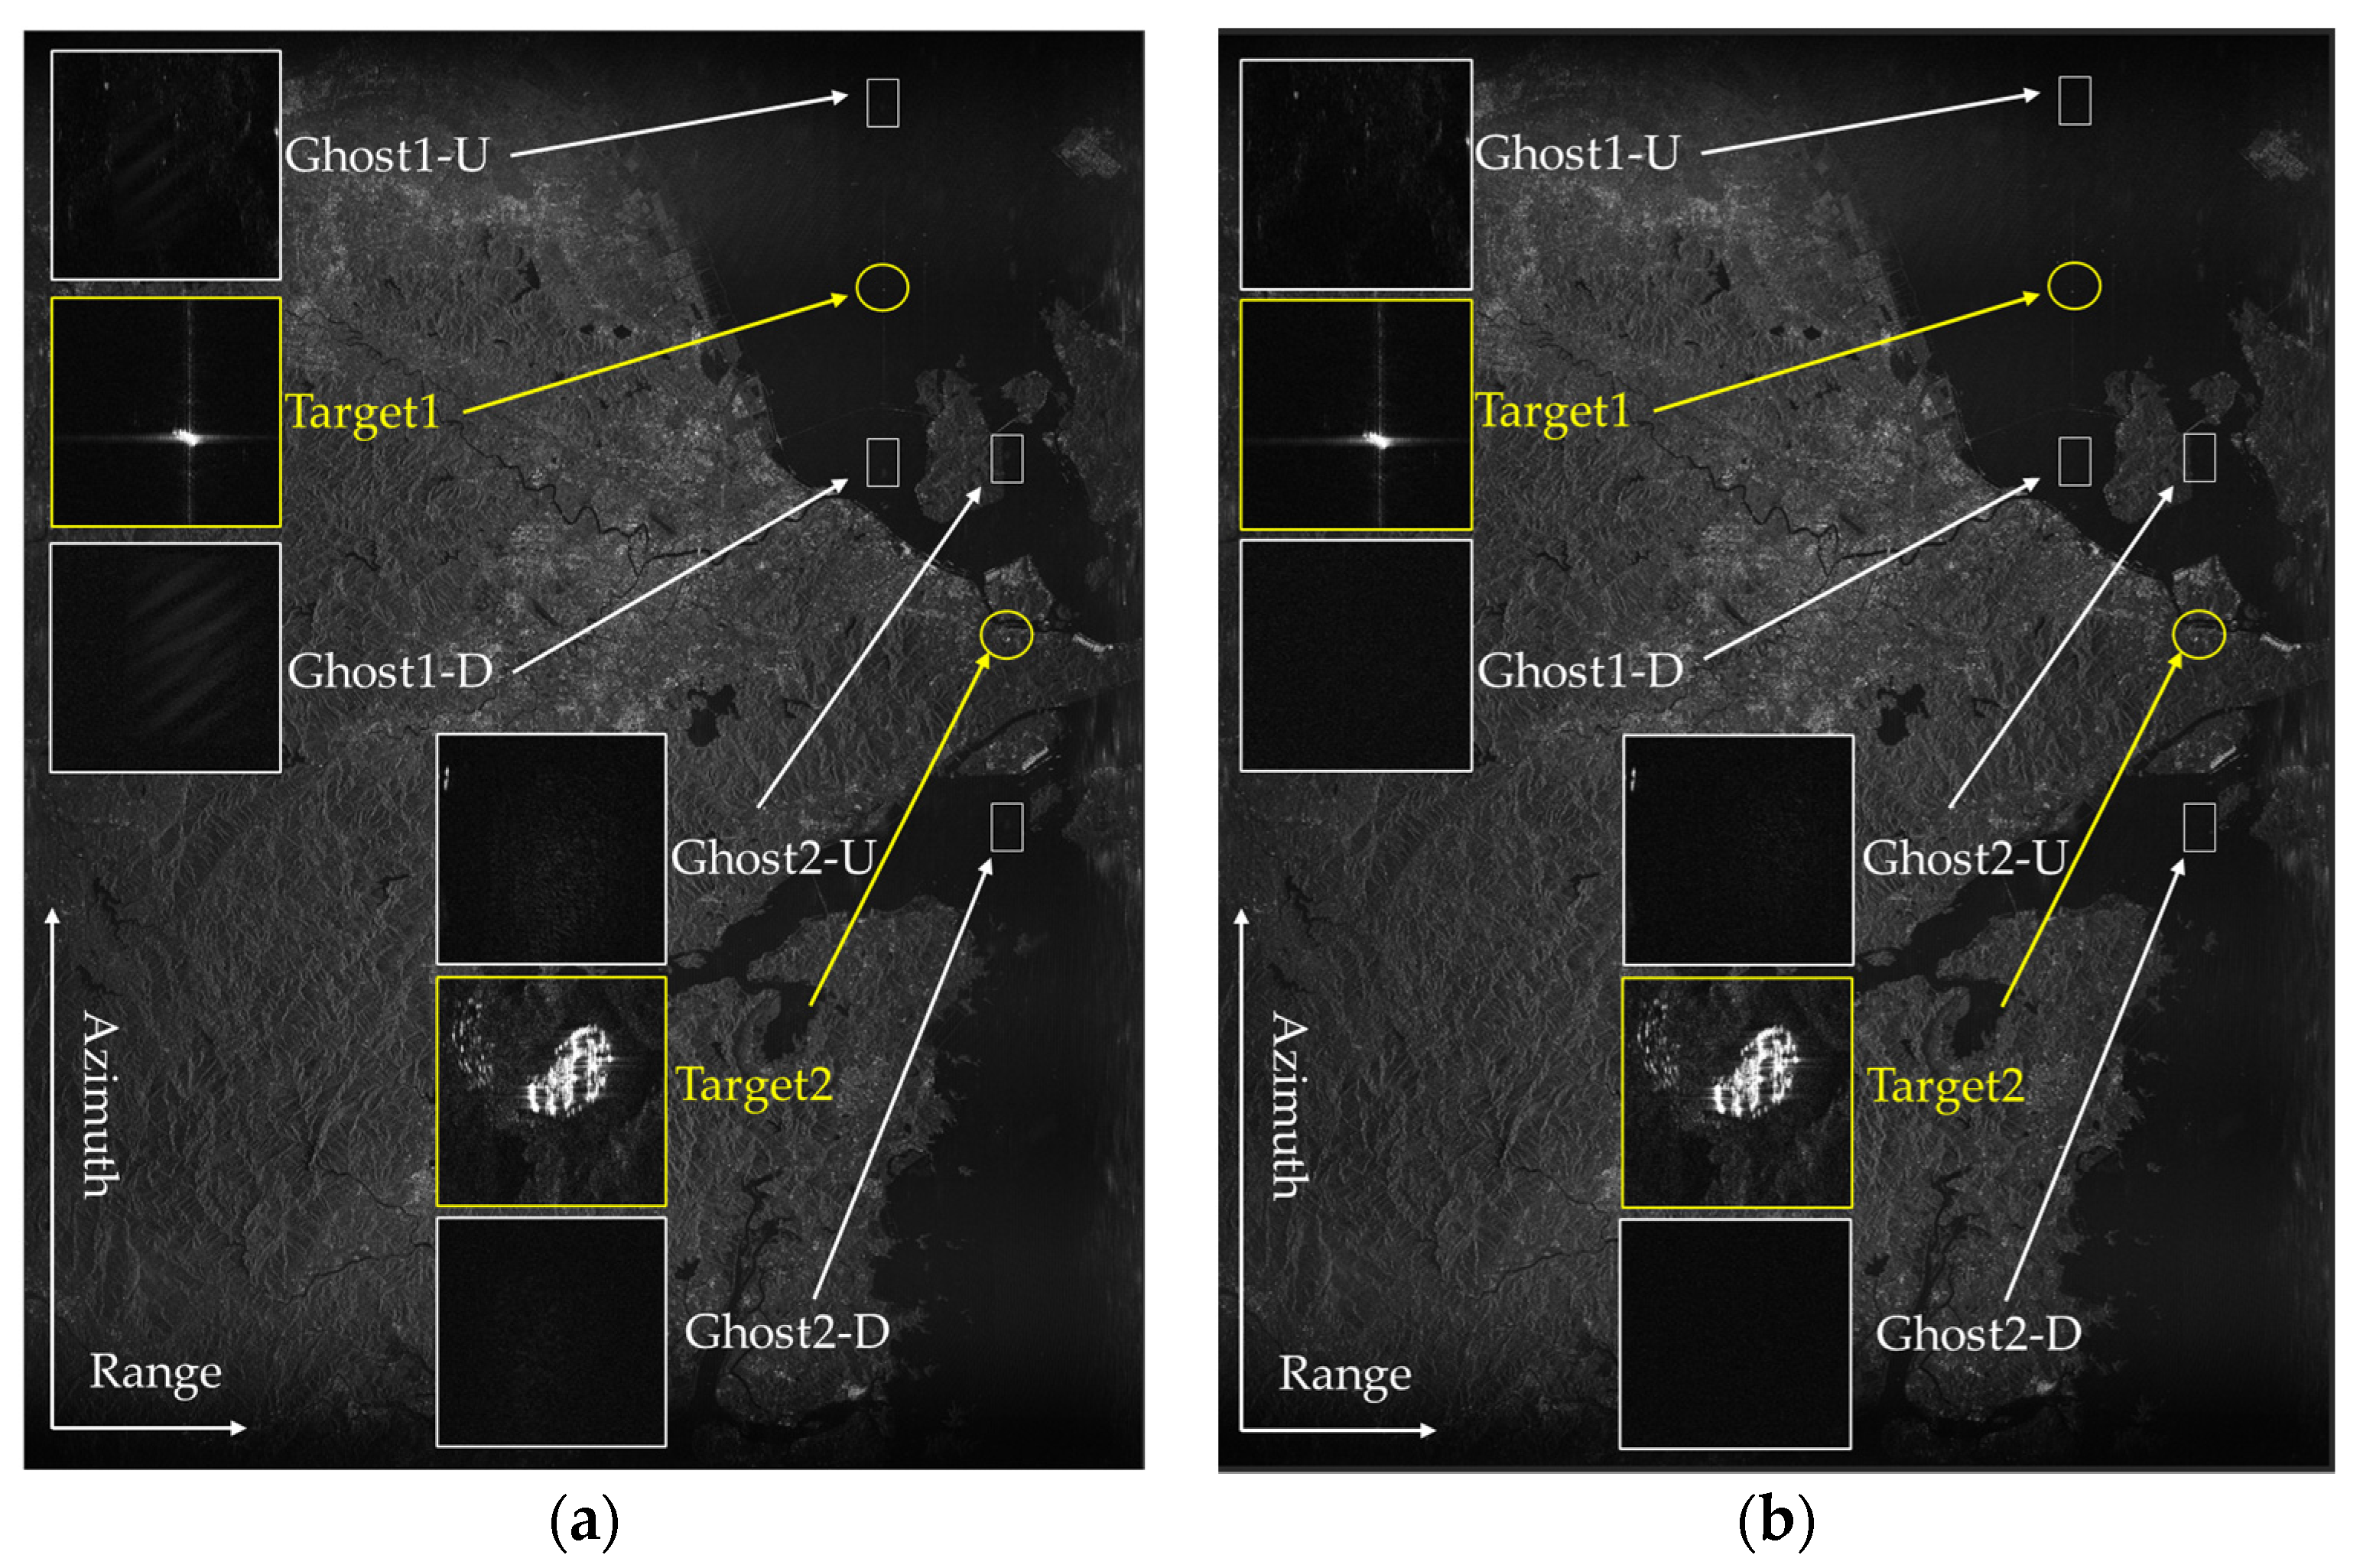
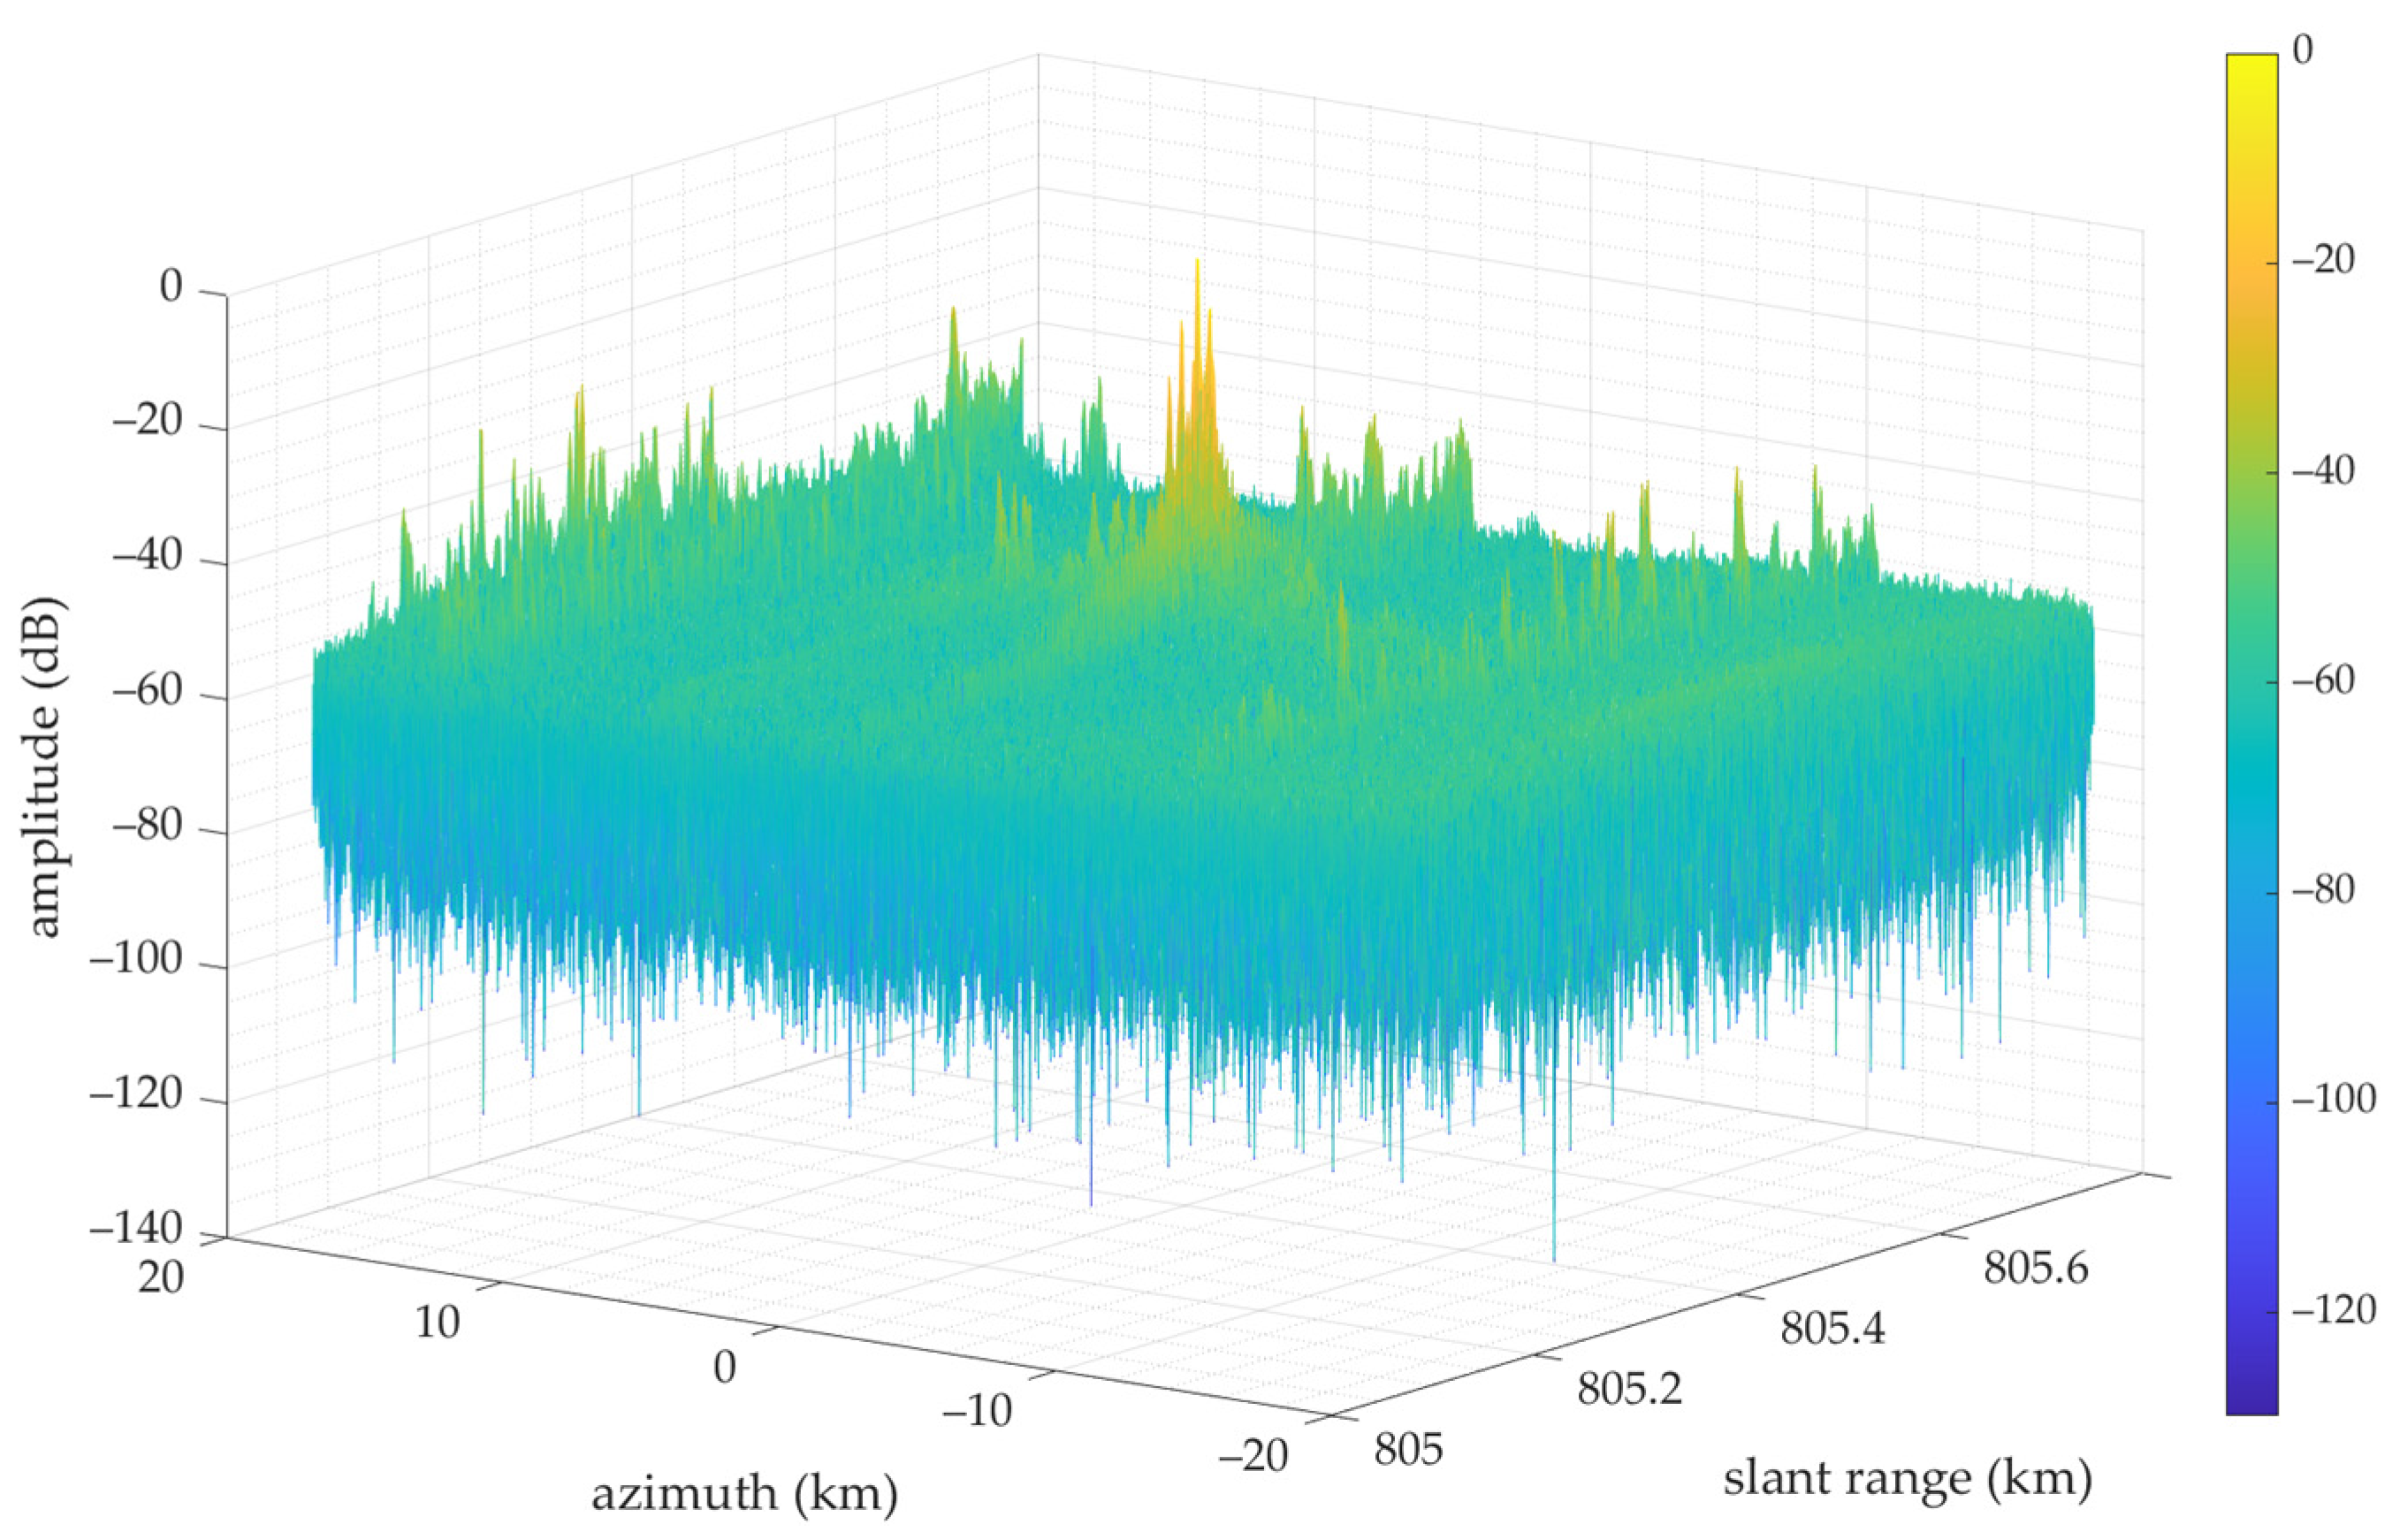
4.3.3. Land and Sea Interface Scenarios

In ambiguity azimuth analysis, other targets in the land scene often interfere with the amplitude of the false target. In the case of superimposed clutter interference, the amplitude of the false target even exceeds the target itself, so AASR cannot be accurately estimated. Therefore, this paper chooses a land and sea interface scene for processing. The scene of this experiment is the dual-antenna receiving data measured by LT-1 in the sea off Ningbo City on 9 February 2022. The R 0 was 767 km and V s was 7277 m/s. The estimated amplitude error of this scenario is 0.3890 dB. Due to the excellent channel error control performance of LT-1, the dual-channel echo data of LT-1 has excellent azimuth fuzzy suppression performance. By comparing Figure 17a without channel error correction with Figure 17b focusing image after channel error correction, it can be found that the azimuth fuzzy of the focusing image directly reconstructed by echo data is almost invisible.
The displacement in azimuth and slant range of the first-order ambiguity relative to the primary response is approximately given by [34,35]
Δ az , 1 λ PRF R 0 2 V s
Δ r g , 1 R 0 2 Δ a z , 1 2 R 0
According to Equations (28) and (29), the distance between the first-order ambiguity and the target and the ambiguity dispersed distance is 18.255 km and 217.2085 m. It can be seen from Figure 18 that the azimuth direction of the first-order ambiguity and the range direction of the first-order ambiguity are consistent with the calculated results. Due to the long wavelength of the L-band, the imaging results are mainly affected by the first-order ambiguity, and the first-order ambiguity discretization is serious.
To quantitatively analyze the image quality, the ghost-real target energy ratio (GTER) [20] is employed to measure the suppression of the ghost target in the final focused image without phase error calibration, which is defined as
GTER = 20 log 10 max ( | I G | ) max ( | I R | )
where max ( | I G | ) denotes the maximum amplitude value of pixels of ghost targets, and max ( | I R | ) denotes the maximum value of pixels of real targets. The GTER result of Target 1 is −52 dB, which shows the LT-1′s sound azimuth ambiguity performance.

4.4. Discussion

The experimental results in Section 3 and Section 4 demonstrate an effective suppression of azimuth ambiguities for different scene targets with the LT-1 DRA mode. The simulation experiment in Section 3 shows that, compared with other SAR systems with shorter wavelength segments, LT-1 adopts an L-band, which can significantly reduce the influence of antenna installation on the channel phase error. At the same time, thanks to the excellent system design of LT-1, the channel phase error of LT-1 is always controlled within 10 deg during the on-orbit operation, which enables the dual antennas of LT-1 to receive data and carry out signal reconstruction and focusing imaging operations without going through the channel error correction. Therefore, in the face of sudden disasters and other emergencies, HRWS SAR imaging can save time for channel error correction. In Section 4, this paper deals with the measured data from different scenarios. Point-like target analysis is performed by analyzing the system’s response to the reflector in the Xinjiang calibration field. The experimental results thoroughly verify the ambiguity suppression capability of the LT-1 system.

5. Conclusions

This paper established the channel error model of LT-1 DRA mode, and the influence of channel error on imaging quality was analyzed. The channel phase error of LT-1 was efficiently estimated using the MLNS method. Experiments showed that the LT-1 system can suppress azimuth ambiguity successfully by using DRA mode. The LT-1 benefits from an excellent SAR system design that allows amplitude-phase errors to be controlled within the system design requirements, requiring little additional channel error calibration operations. The LT-1 has shown the expected performance and resolution during in-orbit operation, and the parameters related to image quality are excellent.

Author Contributions

Conceptualization, Z.X.; Methodology, Z.X. and Y.C.; Funding acquisition, P.L. and R.W.; Projection administration, P.L. and R.W.; Writing—original draft, Z.X.; Writing—review and editing, Z.X., Y.C., R.W. and Y.W. All authors have read and agreed to the published version of the manuscript.

Funding

This research was funded by the National Science Fund for Distinguished Young Scholars, China, grant number No. 61825106.

Data Availability Statement

Not applicable.

Conflicts of Interest

The authors declare no conflict of interest.

References

  1. Cumming, I.G.; Wong, F.H. Digital processing of synthetic aperture radar data. Artech House 2005, 1, 108–110. [Google Scholar]
  2. Li, Z.; Wang, H.; Su, T.; Bao, Z. Generation of wide-swath and high-resolution SAR images from multichannel small spaceborne SAR systems. IEEE Geosci. Remote Sens. Lett. 2005, 2, 82–86. [Google Scholar] [CrossRef]
  3. Krieger, G.; Gebert, N.; Moreira, A. Unambiguous SAR signal reconstruction from nonuniform displaced phase center sampling. IEEE Geosci. Remote Sens. Lett. 2004, 1, 260–264. [Google Scholar] [CrossRef]
  4. Krieger, G.; Gebert, N.; Moreira, A. Multidimensional waveform encoding: A new digital beamforming technique for synthetic aperture radar remote sensing. IEEE Trans. Geosci. Remote Sens. 2007, 46, 31–46. [Google Scholar] [CrossRef]
  5. Jing, W.; Xing, M.; Qiu, C.-W.; Bao, Z.; Yeo, T.-S. Unambiguous reconstruction and high-resolution imaging for multiple-channel SAR and airborne experiment results. IEEE Geosci. Remote Sens. Lett. 2008, 6, 102–106. [Google Scholar] [CrossRef]
  6. Krieger, G.; Gebert, N.; Younis, M.; Bordoni, F.; Patyuchenko, A.; Moreira, A. Advanced concepts for ultra-wide-swath SAR imaging. In Proceedings of the 7th European Conference on Synthetic Aperture Radar, Friedrichshafen, Germany, 2–5 June 2008; pp. 1–4. [Google Scholar]
  7. Yunkai, D.; Weidong, Y.; Heng, Z.; Wei, W.; Dacheng, L.; Robert, W. Forthcoming spaceborne SAR development. J. Radars 2020, 9, 1–33. [Google Scholar]
  8. Yingjie, W.; Robert, W.; Weidong, Y.; Qingchao, Z.; Kaiyu, L.; Dacheng, L.; Yunkai, D.; Naiming, O.; Xiaoxue, J.; Heng, Z.; et al. See-Earth: SAR Constellation with Dense Time-SEries for Multi-dimensional Environmental Monitoring of the Earth. J. Radars 2021, 10, 842–864. [Google Scholar] [CrossRef]
  9. Fu, Z.; Zhang, H.; Zhao, J.; Li, N.; Zheng, F. A Modified 2-D Notch Filter Based on Image Segmentation for RFI Mitigation in Synthetic Aperture Radar. Remote Sens. 2023, 15, 846. [Google Scholar] [CrossRef]
  10. Currie, A.; Brown, M.A. Wide-swath SAR. In IEE Proceedings F (Radar and Signal Processing); IET: Wales, UK, 1992; pp. 122–135. [Google Scholar]
  11. Süß, M.; Grafmüller, B.; Zahn, R. A novel high resolution, wide swath SAR system. In Proceedings of the IGARSS 2001. Scanning the Present and Resolving the Future. IEEE 2001 International Geoscience and Remote Sensing Symposium (Cat. No. 01CH37217), Sydney, NSW, Australia, 9–13 July 2001; pp. 1013–1015. [Google Scholar]
  12. Kim, J.-H.; Younis, M.; Gabele, M.; Prats, P.; Krieger, G. First spaceborne experiment of digital beam forming with TerraSAR-X dual receive antenna mode. In Proceedings of the 2011 8th European Radar Conference, Manchester, UK, 12–14 October 2011; pp. 41–44. [Google Scholar]
  13. Younis, M.; De Almeida, F.Q.; Bordoni, F.; López-Dekker, P.; Krieger, G. Digital beamforming techniques for multi-channel synthetic aperture radar. In Proceedings of the 2016 IEEE International Geoscience and Remote Sensing Symposium (IGARSS), Beijing, China, 10–15 July 2016; pp. 1412–1415. [Google Scholar]
  14. Hatooka, Y.; Kankaku, Y.; Arikawa, Y.; Suzuki, S. First result from ALOS-2 operation. In Proceedings of the Earth Observing Missions and Sensors: Development, Implementation, and Characterization III, San Francisco, CA, USA, 18 December 2014; pp. 138–147. [Google Scholar]
  15. Jin, T.; Qiu, X.; Hu, D.; Ding, C. Unambiguous imaging of static scenes and moving targets with the first Chinese dual-channel spaceborne SAR sensor. Sensors 2017, 17, 1709. [Google Scholar] [CrossRef]
  16. Qingjun, Z. System design and key technologies of the GF-3 satellite. Acta Geod. Cartogr. Sin. 2017, 46, 269. [Google Scholar]
  17. Shi, J.; Lü, D.; Wang, Y.; Du, Y.; Pang, Y.; Yang, D.; Wang, X.; Dong, X.; Yang, X. Recent Progress of Earth Science Satellite Missions in China. Chin. J. Space Sci. 2022, 42, 712–723. [Google Scholar] [CrossRef]
  18. Cai, Y.; Wang, R.; Yu, W.; Liang, D.; Liu, K.; Zhang, H.; Chen, Y. An Advanced Approach to Improve Synchronization Phase Accuracy with Compressive Sensing for LT-1 Bistatic Spaceborne SAR. Remote Sens. 2022, 14, 4621. [Google Scholar] [CrossRef]
  19. Cai, Y.; Deng, Y.; Zhang, H.; Wang, R.; Wu, Y.; Cheng, S. An Image-Domain Least L 1-Norm Method for Channel Error Effect Analysis and Calibration of Azimuth Multi-Channel SAR. IEEE Trans. Geosci. Remote Sens. 2022, 60, 1–14. [Google Scholar] [CrossRef]
  20. Yang, W.; Guo, J.; Chen, J.; Liu, W.; Deng, J.; Wang, Y.; Zeng, H. A Novel Channel Inconsistency Estimation Method for Azimuth Multichannel SAR Based on Maximum Normalized Image Sharpness. IEEE Trans. Geosci. Remote Sens. 2022, 60, 1–16. [Google Scholar] [CrossRef]
  21. Shang, M.; Qiu, X.; Han, B.; Ding, C.; Hu, Y. Channel Imbalances and Along-Track Baseline Estimation for the GF-3 Azimuth Multichannel Mode. Remote Sens. 2019, 11, 1297. [Google Scholar] [CrossRef]
  22. Gebert, N.; de Almeida, F.Q.; Krieger, G. Airborne demonstration of multichannel SAR imaging. IEEE Geosci. Remote Sens. Lett. 2011, 8, 963–967. [Google Scholar] [CrossRef]
  23. Li, Z.; Bao, Z.; Wang, H.; Liao, G. Performance improvement for constellation SAR using signal processing techniques. IEEE Trans. Aerosp. Electron. Syst. 2006, 42, 436–452. [Google Scholar]
  24. Feng, J.; Gao, C.; Zhang, Y.; Wang, R. Phase mismatch calibration of the multichannel SAR based on azimuth cross correlation. IEEE Geosci. Remote Sens. Lett. 2012, 10, 903–907. [Google Scholar] [CrossRef]
  25. Zhang, L.; Gao, Y.; Liu, X. Robust channel phase error calibration algorithm for multichannel high-resolution and wide-swath SAR imaging. IEEE Geosci. Remote Sens. Lett. 2017, 14, 649–653. [Google Scholar] [CrossRef]
  26. Xiang, J.; Ding, X.; Sun, G.-C.; Zhang, Z.; Xing, M.; Liu, W. An Efficient Multichannel SAR Channel Phase Error Calibration Method Based on Fine-Focused HRWS SAR Image Entropy. IEEE J. Sel. Top. Appl. Earth Obs. Remote Sens. 2022, 15, 7873–7885. [Google Scholar] [CrossRef]
  27. Zhang, S.-X.; Xing, M.-D.; Xia, X.-G.; Liu, Y.-Y.; Guo, R.; Bao, Z. A robust channel-calibration algorithm for multi-channel in azimuth HRWS SAR imaging based on local maximum-likelihood weighted minimum entropy. IEEE Trans. Image Process. 2013, 22, 5294–5305. [Google Scholar] [CrossRef] [PubMed]
  28. Xu, Z.; Lu, P.; Cai, Y.; Li, J.; Yang, T.; Wu, Y.; Wang, R. An Efficient Channel Imbalance Estimation Method Based on Subadditivity of Linear Normed Space of Sub-Band Spectrum for Azimuth Multichannel SAR. Remote Sens. 2023, 15, 1561. [Google Scholar] [CrossRef]
  29. Laskowski, P.; Bordoni, F.; Younis, M. Antenna pattern compensation in multi-channel azimuth reconstruction algorithm. In Proceedings of the Advanced RF Sensors and Remote Sensing Instruments (ARSI), Noordwijk, The Netherlands, 15 September 2011; pp. 1–10. [Google Scholar]
  30. Shang, M.; Qiu, X.; Han, B.; Yang, J.; Zhong, L.; Ding, C.; Hu, Y. The space-time variation of phase imbalance for GF-3 azimuth multichannel mode. IEEE J. Sel. Top. Appl. Earth Obs. Remote Sens. 2020, 13, 4774–4788. [Google Scholar] [CrossRef]
  31. Yu, W.; Wang, K.; Wu, J.; Li, S.; Xie, W.; Sun, H.; Ou, N. The LuTan-1 SAR Antenna System. In Proceedings of the EUSAR 2022, 14th European Conference on Synthetic Aperture Radar, Leipzig, Germany, 25–27 July 2022; pp. 1–4. [Google Scholar]
  32. Maligranda, L. Some remarks on the triangle inequality for norms. Banach J. Math. Anal. 2008, 2, 31–41. [Google Scholar] [CrossRef]
  33. Mou, J.; Hong, J.; Wang, Y.; Du, S.; Xing, K.; Qiu, T. LT-1 Baseline Calibration Method Based on Improved Baseline Calibration Model. In Proceedings of the IGARSS 2022–2022 IEEE International Geoscience and Remote Sensing Symposium, Kuala Lumpur, Malaysia, 17–22 July 2022; pp. 7452–7455. [Google Scholar]
  34. Villano, M.; Krieger, G. Spectral-based estimation of the local azimuth ambiguity-to-signal ratio in SAR images. IEEE Trans. Geosci. Remote Sens. 2013, 52, 2304–2313. [Google Scholar] [CrossRef]
  35. Li, F.K.; Johnson, W.T.K. Ambiguities in Spacebornene Synthetic Aperture Radar Systems. IEEE Trans. Aerosp. Electron. Syst. 1983, AES-19, 389–397. [Google Scholar] [CrossRef]
Figure 1. Imaging geometry of LT-1 DRA mode.
Remotesensing 15 02765 g001
Figure 2. Schematic diagram of APC in a dual-channel SAR system.
Remotesensing 15 02765 g002
Figure 3. Phase error caused by APC position error. (a) L-band phase error, (b) C-band phase error, (c) the phase error caused by APC position error and the different antenna beam, and (d) the phase error caused by APC position error and the same antenna beam.
Remotesensing 15 02765 g003
Figure 4. Azimuth profile of point-like target. (a) No channel error, (b) 1.3 dB amplitude error, (c) 0.5 rad phase error, (d) time-variant phase error caused by APC position error, and (e) space-variant phase error caused by APC position error.
Remotesensing 15 02765 g004
Figure 5. Effect of invariant amplitude error on point-like target imaging. (a) PSLR, (b) ISLR, and (c) IRW.
Remotesensing 15 02765 g005
Figure 6. Effect of invariant phase error on point imaging. (a) PSLR, (b) ISLR, and (c) IRW.
Remotesensing 15 02765 g006
Figure 7. Effect of azimuth APC position error on point imaging. (a) PSLR affected by azimuth APC error, (b) ISLR affected by azimuth APC error, and (c) IRW affected by azimuth APC error.
Remotesensing 15 02765 g007
Figure 8. Effect of range APC position error on point imaging. (a) PSLR, (b) ISLR, and (c) IRW.
Remotesensing 15 02765 g008
Figure 9. SAR antenna architecture diagram.
Remotesensing 15 02765 g009
Figure 10. The phase difference and L1 norm of dual-channel frequency domain signal. (a) The phase difference of simulation results, (b) the phase difference of LT-1 measured data results, (c) the L1 norm of simulation results, and (d) the L1 norm of LT-1 measured data results.
Remotesensing 15 02765 g010
Figure 11. Location of the test sites and study area. (a) optical image of the test site, (b) SAR image of the test site.
Remotesensing 15 02765 g011
Figure 12. Phase error estimation and reconstruction spectrum of calibration field scene. (a) Azimuth time-varying phase error estimation, (b) range space-varying phase error estimation, (c) reconstruction spectrum without channel error calibration, and (d) reconstruction spectrum with channel error calibration.
Remotesensing 15 02765 g012
Figure 13. Contour of calibration points. (a) Point 1, (b) point 2, (c) point 3, (d) point 4, (e) point 5, (f) point 6, (g) point 7, and (h) point 8.
Remotesensing 15 02765 g013
Figure 14. Profile of calibration points. (a) Point 1, (b) point 2, (c) point 3, (d) point 4, (e) point 5, (f) point 6, (g) point 7, and (h) point 8.
Remotesensing 15 02765 g014
Figure 15. Imaging results of wilderness scenarios: (a) azimuth time-varying phase error estimation results, (b) range space-varying phase error estimation, (c) reconstruction spectrum without channel error calibration, (d) reconstruction spectrum with channel error calibration, (e) focused image without channel error calibration, and (f) focused image with channel error calibration.
Remotesensing 15 02765 g015aRemotesensing 15 02765 g015b
Figure 16. Imaging results of city scenarios: (a) azimuth time-varying phase error estimation results, (b) range space-varying phase error estimation, (c) reconstruction spectrum without channel error calibration, (d) reconstruction spectrum with channel error calibration (e) focused image without channel error calibration, and (f) focused image with channel error calibration.
Remotesensing 15 02765 g016aRemotesensing 15 02765 g016b
Figure 17. Imaging results of land and sea interface scenarios: (a) focused image without channel error calibration, and (b) focused image with channel error calibration.
Remotesensing 15 02765 g017
Figure 18. Imaging results of Target 1 and Ghost 1.
Remotesensing 15 02765 g018
Table 1. AMC SAR system point-like target simulation parameters.
ParameterSymbolValueUnit
Platform velocity V s 7635 m / s
Carrier frequency f 0 1.26 GHz
Nearest slant range R 0 817 km
Azimuth antenna length L a z 2 × 4.9 m
Doppler bandwidth B a 2761 Hz
Azimuth sampling frequency F a 1795 Hz
Number of channels M 2\
Table 2. Imaging parameters.
ParameterSymbolValueUnit
Platform velocity V s 7635 m / s
Carrier frequency f 0 1.26 GHz
Signal bandwidth B r 80 MHz
Signal pulse duration T p 70 μ s
Nearest slant range R 0 817 km
Azimuth antenna length L a z 4.9 × 2 m
Rang sampling frequency F r 90 MHz
Azimuth sampling frequency F a 1742 Hz
Number of channels M 2\
Table 3. Calibration point coordinates.
Calibration Point12345678
Latitude42.0143542.0150842.0146442.0148342.0155342.0156842.0164842.01237
Longitude91.8046091.8403991.8807291.9212491.9642592.0135892.0784192.14480
Disclaimer/Publisher’s Note: The statements, opinions and data contained in all publications are solely those of the individual author(s) and contributor(s) and not of MDPI and/or the editor(s). MDPI and/or the editor(s) disclaim responsibility for any injury to people or property resulting from any ideas, methods, instructions or products referred to in the content.

