US9311959B1 - Read channel optimization using multi-dimensional smoothing - Google Patents
Read channel optimization using multi-dimensional smoothing Download PDFInfo
- Publication number
- US9311959B1 US9311959B1 US14/673,500 US201514673500A US9311959B1 US 9311959 B1 US9311959 B1 US 9311959B1 US 201514673500 A US201514673500 A US 201514673500A US 9311959 B1 US9311959 B1 US 9311959B1
- Authority
- US
- United States
- Prior art keywords
- zones
- data
- read channel
- channel parameter
- error rate
- Prior art date
- Legal status (The legal status is an assumption and is not a legal conclusion. Google has not performed a legal analysis and makes no representation as to the accuracy of the status listed.)
- Active
Links
Images


Classifications
-
- G—PHYSICS
- G11—INFORMATION STORAGE
- G11B—INFORMATION STORAGE BASED ON RELATIVE MOVEMENT BETWEEN RECORD CARRIER AND TRANSDUCER
- G11B20/00—Signal processing not specific to the method of recording or reproducing; Circuits therefor
- G11B20/10—Digital recording or reproducing
- G11B20/18—Error detection or correction; Testing, e.g. of drop-outs
- G11B20/1833—Error detection or correction; Testing, e.g. of drop-outs by adding special lists or symbols to the coded information
-
- G—PHYSICS
- G11—INFORMATION STORAGE
- G11B—INFORMATION STORAGE BASED ON RELATIVE MOVEMENT BETWEEN RECORD CARRIER AND TRANSDUCER
- G11B20/00—Signal processing not specific to the method of recording or reproducing; Circuits therefor
- G11B20/10—Digital recording or reproducing
- G11B20/10009—Improvement or modification of read or write signals
-
- G—PHYSICS
- G05—CONTROLLING; REGULATING
- G05B—CONTROL OR REGULATING SYSTEMS IN GENERAL; FUNCTIONAL ELEMENTS OF SUCH SYSTEMS; MONITORING OR TESTING ARRANGEMENTS FOR SUCH SYSTEMS OR ELEMENTS
- G05B13/00—Adaptive control systems, i.e. systems automatically adjusting themselves to have a performance which is optimum according to some preassigned criterion
- G05B13/02—Adaptive control systems, i.e. systems automatically adjusting themselves to have a performance which is optimum according to some preassigned criterion electric
-
- G—PHYSICS
- G11—INFORMATION STORAGE
- G11B—INFORMATION STORAGE BASED ON RELATIVE MOVEMENT BETWEEN RECORD CARRIER AND TRANSDUCER
- G11B20/00—Signal processing not specific to the method of recording or reproducing; Circuits therefor
- G11B20/10—Digital recording or reproducing
- G11B20/10009—Improvement or modification of read or write signals
- G11B20/10046—Improvement or modification of read or write signals filtering or equalising, e.g. setting the tap weights of an FIR filter
-
- G—PHYSICS
- G11—INFORMATION STORAGE
- G11B—INFORMATION STORAGE BASED ON RELATIVE MOVEMENT BETWEEN RECORD CARRIER AND TRANSDUCER
- G11B20/00—Signal processing not specific to the method of recording or reproducing; Circuits therefor
- G11B20/10—Digital recording or reproducing
- G11B20/10009—Improvement or modification of read or write signals
- G11B20/10481—Improvement or modification of read or write signals optimisation methods
- G11B20/105—Improvement or modification of read or write signals optimisation methods selecting parameter values from a plurality of predetermined settings
-
- G—PHYSICS
- G11—INFORMATION STORAGE
- G11B—INFORMATION STORAGE BASED ON RELATIVE MOVEMENT BETWEEN RECORD CARRIER AND TRANSDUCER
- G11B20/00—Signal processing not specific to the method of recording or reproducing; Circuits therefor
- G11B20/10—Digital recording or reproducing
- G11B20/10009—Improvement or modification of read or write signals
- G11B20/10481—Improvement or modification of read or write signals optimisation methods
- G11B20/10509—Improvement or modification of read or write signals optimisation methods iterative methods, e.g. trial-and-error, interval search, gradient descent or feedback loops
-
- G—PHYSICS
- G11—INFORMATION STORAGE
- G11B—INFORMATION STORAGE BASED ON RELATIVE MOVEMENT BETWEEN RECORD CARRIER AND TRANSDUCER
- G11B20/00—Signal processing not specific to the method of recording or reproducing; Circuits therefor
- G11B20/10—Digital recording or reproducing
- G11B20/18—Error detection or correction; Testing, e.g. of drop-outs
-
- G—PHYSICS
- G11—INFORMATION STORAGE
- G11B—INFORMATION STORAGE BASED ON RELATIVE MOVEMENT BETWEEN RECORD CARRIER AND TRANSDUCER
- G11B7/00—Recording or reproducing by optical means, e.g. recording using a thermal beam of optical radiation by modifying optical properties or the physical structure, reproducing using an optical beam at lower power by sensing optical properties; Record carriers therefor
- G11B7/08—Disposition or mounting of heads or light sources relatively to record carriers
- G11B7/083—Disposition or mounting of heads or light sources relatively to record carriers relative to record carriers storing information in the form of optical interference patterns, e.g. holograms
-
- G—PHYSICS
- G11—INFORMATION STORAGE
- G11B—INFORMATION STORAGE BASED ON RELATIVE MOVEMENT BETWEEN RECORD CARRIER AND TRANSDUCER
- G11B7/00—Recording or reproducing by optical means, e.g. recording using a thermal beam of optical radiation by modifying optical properties or the physical structure, reproducing using an optical beam at lower power by sensing optical properties; Record carriers therefor
- G11B7/007—Arrangement of the information on the record carrier, e.g. form of tracks, actual track shape, e.g. wobbled, or cross-section, e.g. v-shaped; Sequential information structures, e.g. sectoring or header formats within a track
- G11B7/00772—Arrangement of the information on the record carrier, e.g. form of tracks, actual track shape, e.g. wobbled, or cross-section, e.g. v-shaped; Sequential information structures, e.g. sectoring or header formats within a track on record carriers storing information in the form of optical interference patterns, e.g. holograms
- G11B7/00781—Auxiliary information, e.g. index marks, address marks, pre-pits, gray codes
Definitions
- Various embodiments of the present disclosure are generally directed to the selection of optimal channel parameters for a read channel of a data storage device.
- a method includes obtaining raw error rate data for different read channel parameter values in each of a plurality of zones of a memory.
- the raw error rate data for each of the different read channel parameter values are filtered to provide a sequence of second order polynomial curves with smoothed data points in each of the zones.
- a second order regression is applied to the smoothed data points in each of the zones to provide a sequence of regression curves.
- An optimal read channel parameter value for each of the zones is selected using the sequence of regression curves, and the optimal read channel parameter values are used during subsequent read operations to retrieve data stored in the zones.
- an apparatus in other embodiments, includes a memory, a read channel and an analysis engine.
- the memory includes a plurality of zones.
- the read channel is adapted to reconstruct data stored in the memory.
- the analysis engine selects an optimal read channel parameter for use by the read channel during read operations with each of the respective zones.
- the analysis engine is configured to filter raw error rate data for each of a plurality of settings of the read channel parameter to provide a sequence of second order polynomial curves with smoothed data points in each of the zones, to apply a second order regression to the smoothed data points in each of the zones to provide a sequence of regression curves, and to select the optimal read channel parameter for each of the zones using a minimum point in each of the sequence of regression curves.
- FIG. 1 is a block diagram for a data storage device in accordance with some embodiments.
- FIG. 2 is a block diagram of a read channel processing portion of the device of FIG. 1 .
- FIG. 3 shows aspects of the rotatable media of FIG. 1 .
- FIG. 4 is a functional block diagram of an analysis engine used in accordance with various embodiments to establish optimal read channel parameter values for the read channel circuitry of FIG. 2 .
- FIG. 5 is a flow chart for a read channel optimization routine carried out by the analysis engine of FIG. 4 .
- FIG. 6 is a raw data table to show an illustrative format for raw data acquired by the routine of FIG. 5 .
- FIG. 7 is a graphical representation of a multi-dimensional raw data map structure corresponding to the data from the table in FIG. 6 .
- FIG. 8 is a flow chart for a multi-zone smoothing routine carried out in accordance with the flow of FIG. 5 .
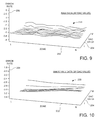
- FIG. 9 is a graphical representation of the raw data from FIG. 7 expressed as segmented lines for different digital to analog converter (DAC) values.
- DAC digital to analog converter
- FIG. 10 is a graphical representation of smoothed data obtained from the application of the routine of FIG. 8 to the raw data in FIG. 9 .
- FIG. 11 is a flow chart for a regression analysis routine carried out upon the smoothed data from FIG. 10 in accordance with the routine of FIG. 5 .
- FIG. 12 is a graphical representation of regression data by zone obtained by the routine of FIG. 11 .
- FIG. 13 is a flow chart for a final zone value selection routine carried out upon the final values from FIG. 11 in accordance with the routine of FIG. 5 .
- the present disclosure generally relates to data storage systems, and more particularly to a method and apparatus for optimizing read channel parameters in a storage device.
- Data storage devices store and retrieve computerized data in a fast and efficient manner. Such devices often utilize one or more forms of physical memory devices to store the data pending a subsequent data retrieval operation. A read channel is often employed to enable the decoding and reconstruction of the originally stored data.
- Read channels may be realized in hardware, software and/or firmware and can apply sophisticated filtering, signal processing, data decoding, error correction and decryption operations as part of a data recovery process.
- Read channels often employ adaptively determined read channel parameters that are loaded and used as required for different memory locations (e.g., different head/disc combinations, different zones, etc.) and conditions (e.g., data/memory aging, temperature, etc.).
- adaptive read channel parameters include digital to analog converter (DAC) values, filter tap weights, timing values, threshold levels, etc.
- DAC digital to analog converter
- BER bit error rate
- LMS least mean squares
- various embodiments of the present disclosure are generally directed to an apparatus and method for optimizing parameter values for a read channel.
- some embodiments include obtaining raw error rate data for different read channel parameter values in each of a plurality of concentric zones on a rotatable data recording medium.
- the raw error rate data for each of the different reach channel parameter values are filtered (smoothed) to provide a sequence of second order polynomial curves with smoothed data points in each of the zones.
- a second order regression analysis is applied to the smoothed data points in each of the zones to provide a regression curve for each zone.
- An optimal read channel parameter value is selected for each of the zones using the sequence of regression curves, and the optimal read channel parameter values are thereafter used during subsequent read operations from the zones.
- zone smoothing is applied on a zone (bucket) basis taking all obtained samples into account, not just in-range values as in the prior art. This provides a more robust solution particularly for unstable readers.
- FIG. 1 shows aspects of an exemplary data storage device 100 .
- the data storage device 100 is characterized as a hard disc drive (HDD) of the type that uses one or more rotatable data recording media 102 and a corresponding array of moveable data read/write transducers 104 to store and retrieve data from a host device.
- HDD hard disc drive
- the transducer 104 in FIG. 1 also referred to herein as a head, includes at least one write (W) element 106 and at least one read (R) element 108 .
- the write element 106 is used to write data to data tracks defined on a data recording surface 102 A of the medium (disc) 102 .
- the write element 106 may take the form of a perpendicular recording write element with a coil, main pole and return pole to establish a magnetic recording pattern with magnetic domains perpendicular to the surface 102 A.
- Other write element configurations can be employed including heat assisted magnetic recording (HAMR), microwave assisted magnetic recording (MAMR), two dimensional magnetic recording (2DMR), three dimensional magnetic recording (3DMR), bit patterned media recording, etc.
- the read element 108 is used to output one or more readback signals which, when decoded, provide the originally stored data.
- the read element may take the form of a magneto-resistive (MR) read element or some other suitable sensor configuration. Multiple read elements may be used to support multi-sensor recording (MSR).
- the transducer 104 can incorporate additional active elements such as electromagnetic radiation sources (e.g., a HAMR laser), proximity sensors, fly-height adjustment mechanisms (e.g., a heater), etc.
- FIG. 1 further shows the transducer 104 to be operably coupled to a preamplifier/driver (preamp) circuit 110 , a read/write (R/W) channel 112 and a data memory buffer 114 .
- preamp preamplifier/driver
- R/W read/write
- data memory buffer 114 a data memory buffer 114 .
- a write channel portion of the R/W channel 112 applies encoding to the data including run length limited (RLL) and error correction coding (ECC), and the preamp 110 supplies time varying bi-directional write currents to the write element 106 to write the encoded data to the medium 102 .
- RLL run length limited
- ECC error correction coding
- a read bias current is applied to the read element 108 to facilitate the generation of a readback signal having pulses corresponding to magnetic flux transitions in the written pattern.
- the preamp 110 applies initial signal processing such as automatic gain control (AGC) and preamplification, and provides a recovered bit sequence to a read channel portion of the R/W channel 112 .
- the read channel applies signal processing techniques including RLL and ECC decoding to recover the originally stored data.
- the recovered data are temporarily placed in the buffer 114 pending transfer to the requesting host.
- FIG. 2 illustrates relevant aspects of a read channel 120 from the R/W channel 112 of FIG. 1 .
- the read channel 120 includes a front end processing block 122 and a rear end processing block 124 .
- the respective blocks 122 , 124 may be incorporated into a single integrated circuit (IC) package or may be divided among multiple discrete chips.
- the front end 122 receives an input sequence during a read operation from the preamp 110 ( FIG. 1 ) and the rear end 124 outputs the originally stored data to the buffer 114 .
- the front end 122 generally performs initial processing steps such as filtering, analog to digital conversion (ADC), detection operations, bit estimations, etc.
- ADC analog to digital conversion
- filter DAC continuous time filter
- the rear end 124 supplies decoding operations to the output from the front end 122 and may include one or more decoders, Viterbi detectors, decision networks, gain stages, etc.
- an exemplary decoder is represented at 128 . As before, this is merely for purposes of providing an illustrative circuit as any number of different types of circuit elements can be incorporated into the rear end 124 depending on the configuration of the channel.
- a controller 130 provides parametric inputs to the read channel 120 , including various DAC values that may be used by the filter DAC 126 and tap weights that may be utilized by the decoder 128 . These and other values supplied to the read channel are generally referred to herein as “read channel parameters” or “read channel parameter values” and are adaptively selected for different operational and physical combinations (e.g., head/zone/track; temperature; data format; aging; etc.).
- the controller 130 may be a programmable processor that uses associated memory 132 to store programming instructions as well as the respective parameters for loading and use as required.
- a servo circuit 134 is further shown in FIG. 2 in combination with the read channel 120 .
- the servo circuit 134 forms a closed loop positional control system to advance the data transducer 104 to various tracks defined on the data recording surface 102 A using demodulated servo data from the associated disc recording surface.
- FIG. 3 shows an arrangement of data on the medium 102 of FIG. 1 .
- a plurality of servo fields 136 or servo wedges, are angularly spaced about the circumference of the medium 102 , like spokes on a wheel.
- the servo fields 136 provide position control information to the servo circuit 134 for closed loop positional control.
- a number of concentric tracks are defined on the surface, one of which is denoted by broken line 138 .
- the track 138 includes the aforementioned servo fields 136 as well as data sector regions 140 in between adjacent pairs of the servo fields 136 .
- Fixed sized data sectors (not separately shown) are formed in the data sector regions to store blocks of user data.
- Groups of adjacent tracks 138 are arranged into a sequence of concentric zones 142 .
- each zone is written at a constant write frequency so that each track in each zone stores the same total amount of user data. While a total of five (5) zones 142 are represented in FIG. 3 , it will be understood that any number of zones can be arranged on the medium, including zones with different numbers of adjacent tracks.
- FIG. 4 is a functional block diagram for an optimization system 150 that operates in accordance with various embodiments of the present disclosure to select optimal read channel parameters for the storage device 100 of FIGS. 1-3 .
- the analysis engine 150 can be realized in hardware, software and/or firmware. In some embodiments, the analysis engine 150 is incorporated into the functionality of the data storage device controller 130 ( FIG. 2 ). In other embodiments, the analysis engine 150 forms a portion of a host device, such as a personal computer or workstation, having one or more processors and corresponding programming in memory to interface with the storage device under test to select and transfer optimal parameter values.
- the analysis engine 150 utilizes various modules including a smoothing function module 152 and a regression module 154 . Once selected, the final channel parameter values are stored in a suitable memory 156 pending subsequent use by the storage device 100 .
- the memory 156 may be non-volatile disc memory (see 102 , FIG. 1 ) and the parameters are transferred to a local volatile memory (see 132 , FIG. 2 ) during device initialization.
- FIG. 5 is a flow chart for a read channel optimization routine 160 carried out by the analysis engine 150 of FIG. 4 in accordance with some embodiments. The various steps set forth in FIG. 5 will be explained in greater detail below.
- routine 160 commences with a data acquisition phase at step 162 during which raw error rate data for different zones and channel parameter values.
- the process continues at step 164 with the application of a multi-zone smoothing function to the raw data on a per channel parameter value basis.
- An intra-zone regression analysis of the smoothed zone parameters is performed at 166 .
- Final values are selected for all zones at step 168 .
- the final values are thereafter used during read operations at step 170 , and the process ends at 172 .
- the read channel parameter being optimized is a DAC value used by a selected element of the read channel 120 , such as the filter DAC 126 (see FIG. 2 ).
- a selected element of the read channel 120 such as the filter DAC 126 (see FIG. 2 ).
- the error rate that is measured and captured during the data acquisition phase (step 162 in FIG. 5 ) will be contemplated as comprising a bit error rate (BER).
- BER bit error rate
- typical BER values may be in the range of, for example, from about 10 ⁇ 2 to 10 ⁇ 3 .
- Other BER ranges may be observed, and other types of error rate values such as channel quality rates, decision error rates, etc. can be used as desired.
- the data acquisition in accordance with the current example is carried out on a zone basis.
- a number of zones are identified for testing on each data recording surface.
- every zone is analyzed.
- a subset of the zones are selected (masked) for analysis, and suitable values are interpolated or extrapolated for the non-selected (unmasked) zones.
- the processing is repeated for each media/head combination in turn.
- Write data in the form of a special test pattern is written to one or more tracks in each of the selected zones.
- the write data may take the form of a repeating pattern such as a 2T pattern. In other cases the data may be specially configured test data with error codes or other encoding to enable assessment of BER.
- the test pattern is written to the data sector regions 140 (see FIG. 2 ) and then read over one or more revolutions of the medium 102 . A sufficient volume of data is read to enable the calculation of an accurate BER.
- FIG. 6 shows a table 180 in memory representing the accumulated (raw) data from the data acquisition step ( 162 , FIG. 5 ).
- Other data structures and formats can be used.
- BER values are obtained for each zone 1 to N using different DAC values from 1 to M where M and N are plural numbers.
- the M DAC values may constitute all of the available DAC input values (e.g., from 1 to 24, etc.) or may be selected values over the associated range (e.g., 4, 8, 12, 16, 20 and 24).
- the value BER_1_1 represents the bit error rate for Zone 1/DAC 1, and so on.
- FIG. 7 shows a raw data map 200 plotted against three orthogonal axes: a zone x-axis 202 , a DAC value y-axis 204 and an error rate z-axis 206 .
- the raw data map 200 provides a three-dimensional (3D) surface of the raw data values from the table 180 in FIG. 6 . It is not necessarily required that a surface such as the map 200 be generated during the routine 160 of FIG. 5 , but the display of such will be helpful during the explanation of the steps carried out by the routine.
- the data are smoothed in accordance with a multi-zone smoothing routine 210 as set forth in FIG. 8 .
- the routine 210 corresponds to step 164 in FIG. 5 and generally operates to fit the data for each DAC setting to a second order polynomial curve.
- the routine 210 includes steps of retrieving the raw data across the N zones for each DAC value (step 212 ).
- the raw data are arranged into a matrix form at step 214 .
- An enhanced second order polynomial filter is generated at step 216 , and the filter is applied to smooth the data at step 218 .
- the raw BER values are graphically represented in FIG. 9 by curve set 220 , plotted against the x, y, z axes 202 , 204 and 206 shown above in FIG. 7 .
- Each of the individual curves (lines) represents the respective raw BER values for a different one of the DAC values, which corresponds to a different column in the table 180 in FIG. 6 .
- the processing of the routine 210 in FIG. 8 results in a second set of smoothed BER values represented in FIG. 10 by curve set 230 .
- the matrices D S and D R have a dimension of [N, M] where N is the total number of zones and M is the total number of DAC values that were analyzed.
- the M Ef matrix is a square matrix of size [N, N] and is an enhanced filter obtained from a basic filter matrix M f .
- the M Ef matrix is a diagonal liked matrix which is superimposed with a submatrix M S .
- each element on the diagonal is aligned with the main tap of the submatrix M S .
- the basic filter matrix can be described as follows:
- M f ⁇ [ ⁇ i ⁇ 3 ⁇ M S ⁇ [ i ] M S ⁇ [ 4 ] M S ⁇ [ 5 ] 0 ... 0 0 0 ⁇ i ⁇ 2 ⁇ M S ⁇ [ i ] M S ⁇ [ 3 ] M S ⁇ [ 4 ] M S ⁇ [ 5 ] ⁇ 0 0 0 M S ⁇ [ 1 ] M S ⁇ [ 2 ] M S ⁇ [ 3 ] M S ⁇ [ 4 ] ⁇ 0 0 0 0 M S ⁇ [ 1 ] M S ⁇ [ 2 ] M S ⁇ [ 3 ] M S ⁇ [ 3 ] ⁇ 0 0 0 ⁇ ⁇ ⁇ ⁇ ⁇ ⁇ 0 ⁇ M S ⁇ [ 3 ] M S ⁇ [ 4 ] M S ⁇ [ 5 ] 0 ⁇ M S ⁇ [ 2 ] M S ⁇ [ 3 ] ⁇ i ⁇ 4 ⁇ M S
- the smoothed data M S can be obtained using equations (1), (3) and (4).
- Other smoothing filter approaches can be used as desired. While not necessarily required, it will be noted that the foregoing approach takes each of the raw data points ( FIG. 9 ) into account in generating the associated smooth data lines ( FIG. 10 ). As before, the graphs of FIGS. 9 and 10 need not necessarily be generated and/or displayed, but are provided to help explain the foregoing processing.
- FIG. 11 shows a regression routine 240 that is next carried out on the smoothed data M S obtained from the routine of FIG. 8 .
- the regression analysis operates upon the smoothed DAC value data in each zone (bucket). As before, the regression analysis operates using a second order function.
- the routine 240 begins by selecting a first zone for analysis at step 242 .
- the smoothed data points (values) for the selected zone are retrieved at step 244 , and a regression analysis is performed on the retrieved data points using a weighted second order polynomial function at step 246 , which will be discussed below.
- a minimum point in the regression output is selected at step 248 , and after a validation check 250 to ensure the minimum point is within the applicable range, the optimal (minimum) value is identified and stored for the selected zone.
- Step 252 determines whether additional zones are to be evaluated; if so, the next zone is selected at step 254 and the foregoing process is repeated. Once all of the zones have been evaluated, the process ends at step 256 . It will be appreciated that at the conclusion of the routine 240 of FIG. 11 , an optimal DAC setting value will have been identified for each masked (evaluated) zone, and the optimal DAC value may be different for each zone.
- the regression process can be characterized as a bucket (zone) curve based process. For each measured zone, bucket data are extracted from the previously smoothed matrix M S .
- the regression function used is a weighted second order polynomial with independent variables corresponding to the DAC values and dependent variables are the smoothed data at the corresponding DAC point.
- a suitable weight function is as follows:
- w ⁇ ( DAC ) exp ⁇ ( - ( D ⁇ ⁇ A ⁇ ⁇ C - D ⁇ A _ ⁇ C ) 2 2 ⁇ ⁇ 2 ) ( 5 )
- D ⁇ C is the median of the three DAC values with the minimum (best) dependent variable data
- the validation step 250 operates to ensure that the minimum (min) DAC point, which is the asymmetry point of the quadratic equation, is valid.
- the min point will be adjudged as being invalid if the min point is outside the existing DAC range, or if the open direction of the resulting curve is facing down, that is, the coefficient a in equation (6) is less than zero (a ⁇ 0). If the min point is found to be invalid, an error handling process will be used to select a new min point. A variety of error handling processes can be used.
- the DAC value is used. Otherwise, a regular quadratic regression can be performed based on the minimum DAC value and its two neighbors and corresponding measurement data.
- FIG. 11 results in the selection of optimal DAC values for each of the analyzed zones, and these optimal DAC values can be stored in memory for subsequent use (e.g., memory 158 , FIG. 4 ).
- FIG. 12 shows a regression curve set 260 representative of a number of regression results for the smoothed data in each zone. As discussed above, the minimum valid data point on each curve is selected as the optimal value. As before, the curves need not necessarily be generated and/or displayed but are provided for purposes of reference.
- An optional DAC zone smoothing operation can next be performed as shown by a final zone selection value routine 280 in FIG. 13 .
- the routine 280 can be used to select appropriate DAC values for other zones that were not analyzed during the foregoing discussion. Similar smoothing is applied to the optimal DAC values as in FIGS. 8 and 10 . Values for zones interspersed between the analyzed zones are interpolated and values for zones that extend beyond the analyzed zones are extrapolated.
- the optimal DAC values obtained from the routine of FIG. 11 are arranged into a 2D array at step 282 .
- DAC values for the remaining (unmasked) zones are derived at step 284 using the same filter matrix approach of FIG. 8 .
- a validation check is performed at step 286 , and the final values for the unmasked zones are stored at step 288 .
- This multiplication may be repeated a selected number of times, such as up to five times, until the total number of iterations is reached or the following relation is satisfied for all zones:
- a validation processing and error handling process is applied as discussed above for out of range or otherwise invalid DAC points.
Abstract
Description
D S =M Ef ×D R (1)
where DS represents a two dimensional (2D) matrix of the smoothed data, MEf is the enhanced filter matrix and DR represents a 2D matrix of the raw data. The matrices DS and DR have a dimension of [N, M] where N is the total number of zones and M is the total number of DAC values that were analyzed. The MEf matrix is a square matrix of size [N, N] and is an enhanced filter obtained from a basic filter matrix Mf.
M S=[−3 12 17 12 −3]/35 (2)
M Ef =M f 100 (4)
where DĀC is the median of the three DAC values with the minimum (best) dependent variable data, and a is a suitable value such as σ=1.4. The weighted polynomial regression can be expressed as follows and has a strict analytical result for each coefficient:
BER(DAC)=aDAC2+bDAC+C (6)
M FINAL =M MIN ×M f (7)
|[DACMIN *n)]−[DACMIN(n+1)]|<1 (8)
Claims (20)
Priority Applications (1)
| Application Number | Priority Date | Filing Date | Title |
|---|---|---|---|
| US14/673,500 US9311959B1 (en) | 2015-03-30 | 2015-03-30 | Read channel optimization using multi-dimensional smoothing |
Applications Claiming Priority (1)
| Application Number | Priority Date | Filing Date | Title |
|---|---|---|---|
| US14/673,500 US9311959B1 (en) | 2015-03-30 | 2015-03-30 | Read channel optimization using multi-dimensional smoothing |
Publications (1)
| Publication Number | Publication Date |
|---|---|
| US9311959B1 true US9311959B1 (en) | 2016-04-12 |
Family
ID=55643268
Family Applications (1)
| Application Number | Title | Priority Date | Filing Date |
|---|---|---|---|
| US14/673,500 Active US9311959B1 (en) | 2015-03-30 | 2015-03-30 | Read channel optimization using multi-dimensional smoothing |
Country Status (1)
| Country | Link |
|---|---|
| US (1) | US9311959B1 (en) |
Cited By (7)
| Publication number | Priority date | Publication date | Assignee | Title |
|---|---|---|---|---|
| US10665256B2 (en) | 2017-06-20 | 2020-05-26 | Seagate Technology Llc | Hybrid timing recovery |
| US10803902B1 (en) | 2018-08-19 | 2020-10-13 | Seagate Technology Llc | Hardware-based read sample averaging |
| US20200410366A1 (en) * | 2019-06-28 | 2020-12-31 | Bull Sas | Automatic determination of the run parameters for a software application on an information processing platform by genetic algorithm and enhanced noise management |
| US11016681B1 (en) * | 2018-07-31 | 2021-05-25 | Seagate Technology Llc | Multi-threshold parameter adaptation |
| US11018842B1 (en) | 2018-07-31 | 2021-05-25 | Seagate Technology Llc | Dynamic timing recovery bandwidth modulation for phase offset mitigation |
| US11170815B1 (en) | 2018-09-27 | 2021-11-09 | Seagate Technology Llc | Cancelling adjacent track interference |
| US11735220B2 (en) | 2021-12-27 | 2023-08-22 | Seagate Technology Llc | Phase locking multiple clocks of different frequencies |
Citations (7)
| Publication number | Priority date | Publication date | Assignee | Title |
|---|---|---|---|---|
| US6216148B1 (en) | 1998-11-12 | 2001-04-10 | Quantum Corporation | Adaptive analog equalizer for partial response channels |
| US6545836B1 (en) * | 1999-11-12 | 2003-04-08 | Acorn Technologies, Inc. | Servo control apparatus and method using absolute value input signals |
| US7006206B2 (en) | 2003-05-01 | 2006-02-28 | Cidra Corporation | Method and apparatus for detecting peaks in an optical signal using a cross-correlation filter |
| US20060171049A1 (en) | 2001-05-31 | 2006-08-03 | Stmicroelectronics S.R.L. | Method and apparatus for optimizing a PRML data-receiving channel for data-storage systems |
| US8310775B1 (en) | 2010-09-30 | 2012-11-13 | Western Digital Technologies, Inc. | Disk drive implementing a read channel optimization process |
| US8396174B2 (en) | 2009-06-03 | 2013-03-12 | Sony Corporation | Data processing apparatus and method |
| US8693120B2 (en) | 2011-03-17 | 2014-04-08 | Lsi Corporation | Systems and methods for sample averaging in data processing |
-
2015
- 2015-03-30 US US14/673,500 patent/US9311959B1/en active Active
Patent Citations (7)
| Publication number | Priority date | Publication date | Assignee | Title |
|---|---|---|---|---|
| US6216148B1 (en) | 1998-11-12 | 2001-04-10 | Quantum Corporation | Adaptive analog equalizer for partial response channels |
| US6545836B1 (en) * | 1999-11-12 | 2003-04-08 | Acorn Technologies, Inc. | Servo control apparatus and method using absolute value input signals |
| US20060171049A1 (en) | 2001-05-31 | 2006-08-03 | Stmicroelectronics S.R.L. | Method and apparatus for optimizing a PRML data-receiving channel for data-storage systems |
| US7006206B2 (en) | 2003-05-01 | 2006-02-28 | Cidra Corporation | Method and apparatus for detecting peaks in an optical signal using a cross-correlation filter |
| US8396174B2 (en) | 2009-06-03 | 2013-03-12 | Sony Corporation | Data processing apparatus and method |
| US8310775B1 (en) | 2010-09-30 | 2012-11-13 | Western Digital Technologies, Inc. | Disk drive implementing a read channel optimization process |
| US8693120B2 (en) | 2011-03-17 | 2014-04-08 | Lsi Corporation | Systems and methods for sample averaging in data processing |
Cited By (11)
| Publication number | Priority date | Publication date | Assignee | Title |
|---|---|---|---|---|
| US10665256B2 (en) | 2017-06-20 | 2020-05-26 | Seagate Technology Llc | Hybrid timing recovery |
| US10714134B2 (en) | 2017-06-20 | 2020-07-14 | Seagate Technology Llc | Approximated parameter adaptation |
| US10936003B1 (en) | 2017-06-20 | 2021-03-02 | Seagate Technology Llc | Phase locking multiple clocks of different frequencies |
| US11361788B2 (en) | 2017-06-20 | 2022-06-14 | Seagate Technology Llc | Data path dynamic range optimization |
| US11016681B1 (en) * | 2018-07-31 | 2021-05-25 | Seagate Technology Llc | Multi-threshold parameter adaptation |
| US11018842B1 (en) | 2018-07-31 | 2021-05-25 | Seagate Technology Llc | Dynamic timing recovery bandwidth modulation for phase offset mitigation |
| US10803902B1 (en) | 2018-08-19 | 2020-10-13 | Seagate Technology Llc | Hardware-based read sample averaging |
| US11341998B1 (en) | 2018-08-19 | 2022-05-24 | Seagate Technology Llc | Hardware-based read sample averaging |
| US11170815B1 (en) | 2018-09-27 | 2021-11-09 | Seagate Technology Llc | Cancelling adjacent track interference |
| US20200410366A1 (en) * | 2019-06-28 | 2020-12-31 | Bull Sas | Automatic determination of the run parameters for a software application on an information processing platform by genetic algorithm and enhanced noise management |
| US11735220B2 (en) | 2021-12-27 | 2023-08-22 | Seagate Technology Llc | Phase locking multiple clocks of different frequencies |
Similar Documents
| Publication | Publication Date | Title |
|---|---|---|
| US9311959B1 (en) | Read channel optimization using multi-dimensional smoothing | |
| US7095577B1 (en) | Disk drive for optimizing write current settings relative to drive operating characteristics and ambient temperature readings | |
| US8154820B1 (en) | Harmonic sensor | |
| US8325432B2 (en) | Systems and methods for servo data based harmonics calculation | |
| EP1596390B1 (en) | Data recording system | |
| US8929186B1 (en) | Disk drive calibrating laser power for heat assisted magnetic recording based on quality metric and track width | |
| KR101489544B1 (en) | Systems and methods for adaptive target search | |
| US9219469B2 (en) | Systems and methods for filter constraint estimation | |
| US20150243310A1 (en) | Systems and Methods for Multi-Head Separation Determination | |
| US8913341B1 (en) | Noise cancellation using cross-track scans | |
| US7290184B2 (en) | Emulation system for evaluating digital data channel configurations | |
| US9837110B1 (en) | Digital data driven position error signal for magnetic recording | |
| US8526133B2 (en) | Systems and methods for user data based fly height calculation | |
| US8300349B2 (en) | Systems and methods for format efficient calibration for servo data based harmonics calculation | |
| US8873181B1 (en) | Method and apparatuses for synchronizing writing of data with a pattern of bit islands of media | |
| US6903889B2 (en) | Method and apparatus for tuning a magnetoresistive bias parameter in a data storage system | |
| US6282251B1 (en) | Modified viterbi detector which accounts for correlated noise | |
| US10553247B2 (en) | Data storage device calibrating data density based on amplitude-inverted or time-inverted read signal | |
| US9245559B2 (en) | Track misregistration sensitive initialization of joint equalizer | |
| US8773811B2 (en) | Systems and methods for zone servo timing gain recovery | |
| US8854756B1 (en) | Systems and methods for mitigating data interference in a contact signal | |
| US6877116B1 (en) | Method and apparatus for determining bit error rate in a sampled data system without requiring read channel circuitry | |
| US9202514B1 (en) | Gated noise-predictive filter calibration | |
| US9153249B1 (en) | Cross-talk measurement in array reader magnetic recording system | |
| US20060146671A1 (en) | Finite field based short error propagation modulation codes |
Legal Events
| Date | Code | Title | Description |
|---|---|---|---|
| AS | Assignment |
Owner name: SEAGATE TECHNOLOGY LLC, CALIFORNIA Free format text: ASSIGNMENT OF ASSIGNORS INTEREST;ASSIGNORS:FAN, HONGJIAN;LE, OAI;ZHU, WENZHONG;AND OTHERS;SIGNING DATES FROM 20150226 TO 20150302;REEL/FRAME:035292/0021 |
|
| STCF | Information on status: patent grant |
Free format text: PATENTED CASE |
|
| MAFP | Maintenance fee payment |
Free format text: PAYMENT OF MAINTENANCE FEE, 4TH YEAR, LARGE ENTITY (ORIGINAL EVENT CODE: M1551); ENTITY STATUS OF PATENT OWNER: LARGE ENTITY Year of fee payment: 4 |
|
| MAFP | Maintenance fee payment |
Free format text: PAYMENT OF MAINTENANCE FEE, 8TH YEAR, LARGE ENTITY (ORIGINAL EVENT CODE: M1552); ENTITY STATUS OF PATENT OWNER: LARGE ENTITY Year of fee payment: 8 |