- >>Weather by month // weather averages La Barra
- >>Climate graph // Weather by Month La Barra
- >>average temperature by month La Barra
- >>Weather La Barra
- >>Water temperature La Barra
La Barra is located in the southern hemisphere. Summer begins at the end of January and ends in December. The months of summer are: December, January, February, March. The most opportune time to visit are January, February.
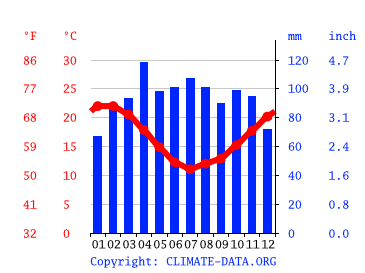
Climate graph // Weather by Month La Barra

Precipitation is the lowest in January, with an average of 67 mm | 2.6 inch. With an average of 118 mm | 4.6 inch, the most precipitation falls in April.
average temperature by month La Barra

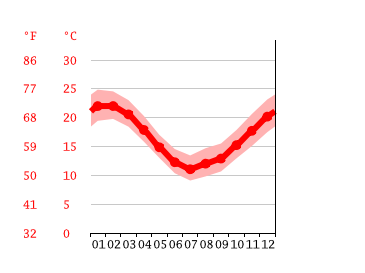
At an average temperature of 22.0 °C | 71.6 °F, February is the hottest month of the year. July has the lowest average temperature of the year. It is 11.1 °C | 51.9 °F.
Weather by month // weather averages La Barra
| Avg. Temperature °C (°F) | Min. Temperature °C (°F) | Max. Temperature °C (°F) | Precipitation / Rainfall mm (in) | Humidity (%) | Rainy days (d) | avg. Sun hours (hours) | |
|---|---|---|---|---|---|---|---|
| January |
22 (71.6) |
19.4 (67) |
24.9 (76.7) |
67 (2.6) |
73% | 4 | 11.0 |
| February |
22 (71.6) |
19.8 (67.6) |
24.6 (76.2) |
87 (3.4) |
75% | 6 | 10.0 |
| March |
20.6 (69) |
18.4 (65.2) |
23 (73.5) |
93 (3.7) |
75% | 7 | 8.0 |
| April |
17.9 (64.2) |
15.8 (60.5) |
20.3 (68.5) |
118 (4.6) |
74% | 8 | 7.0 |
| May |
14.9 (58.7) |
13 (55.4) |
17 (62.6) |
98 (3.9) |
77% | 7 | 6.0 |
| June |
12.3 (54.1) |
10.4 (50.6) |
14.6 (58.2) |
101 (4) |
78% | 8 | 6.0 |
| July |
11.1 (51.9) |
9.1 (48.4) |
13.4 (56.2) |
107 (4.2) |
79% | 8 | 6.0 |
| August |
12 (53.6) |
9.8 (49.7) |
14.7 (58.5) |
101 (4) |
79% | 7 | 7.0 |
| September |
12.9 (55.2) |
10.7 (51.2) |
15.5 (59.9) |
90 (3.5) |
78% | 6 | 7.0 |
| October |
15.2 (59.4) |
12.9 (55.3) |
17.9 (64.1) |
99 (3.9) |
79% | 7 | 8.0 |
| November |
17.7 (63.9) |
15.1 (59.1) |
20.6 (69.1) |
95 (3.7) |
74% | 5 | 10.0 |
| December |
20.2 (68.3) |
17.5 (63.5) |
23.2 (73.7) |
72 (2.8) |
73% | 5 | 11.0 |
| January | February | March | April | May | June | July | August | September | October | November | December | |
|---|---|---|---|---|---|---|---|---|---|---|---|---|
| Avg. Temperature °C (°F) |
22 °C (71.6) °F |
22 °C (71.6) °F |
20.6 °C (69) °F |
17.9 °C (64.2) °F |
14.9 °C (58.7) °F |
12.3 °C (54.1) °F |
11.1 °C (51.9) °F |
12 °C (53.6) °F |
12.9 °C (55.2) °F |
15.2 °C (59.4) °F |
17.7 °C (63.9) °F |
20.2 °C (68.3) °F |
| Min. Temperature °C (°F) |
19.4 °C (67) °F |
19.8 °C (67.6) °F |
18.4 °C (65.2) °F |
15.8 °C (60.5) °F |
13 °C (55.4) °F |
10.4 °C (50.6) °F |
9.1 °C (48.4) °F |
9.8 °C (49.7) °F |
10.7 °C (51.2) °F |
12.9 °C (55.3) °F |
15.1 °C (59.1) °F |
17.5 °C (63.5) °F |
| Max. Temperature °C (°F) |
24.9 °C (76.7) °F |
24.6 °C (76.2) °F |
23 °C (73.5) °F |
20.3 °C (68.5) °F |
17 °C (62.6) °F |
14.6 °C (58.2) °F |
13.4 °C (56.2) °F |
14.7 °C (58.5) °F |
15.5 °C (59.9) °F |
17.9 °C (64.1) °F |
20.6 °C (69.1) °F |
23.2 °C (73.7) °F |
| Precipitation / Rainfall mm (in) |
67 (2) |
87 (3) |
93 (3) |
118 (4) |
98 (3) |
101 (3) |
107 (4) |
101 (3) |
90 (3) |
99 (3) |
95 (3) |
72 (2) |
| Humidity(%) | 73% | 75% | 75% | 74% | 77% | 78% | 79% | 79% | 78% | 79% | 74% | 73% |
| Rainy days (d) | 4 | 6 | 7 | 7 | 7 | 7 | 8 | 7 | 6 | 7 | 5 | 5 |
| avg. Sun hours (hours) | 10.8 | 9.7 | 8.4 | 7.2 | 6.4 | 6.1 | 6.2 | 7.0 | 7.4 | 8.2 | 10.0 | 10.8 |
Data: 1991 - 2021 Min. Temperature °C (°F), Max. Temperature °C (°F), Precipitation / Rainfall mm (in), Humidity, Rainy days. Data: 1999 - 2019: avg. Sun hours
Between the driest and wettest months, the difference in precipitation is 51 mm | 2 inch. During the year, the average temperatures vary by 11.0 °C | 19.7 °F.
It has been determined that August exhibits the highest relative humidity, with a percentage of 79.18. On the other hand, it is observed that during December, there is an extremely low level of relative humidity at only 72.61 percent. The wettest month is July (10.00 days), whilst the driest is January (5.67).
La Barra weather and climate for every month
Hours of sunshine in La Barra
- avg. hours of sun
- Total hours of sun


In December the highest number of daily hours of sunshine is measured in La Barra on average. In December there is an average of 10.81 hours of sunshine a day and a total of 335.16 hours of sunshine throughout December.
In January, the lowest number of daily hours of sunshine is measured in La Barra on average. In January there are an average of 10.81 hours of sunshine per day and a total of 335.16 hours of sunshine.
Around 2983.15 hours of light are counted in La Barra throughout the year. On average, there are 98.16 hours of light per month.
Water temperature La Barra(Atlantic Ocean)

| Max. Water temperature °C (°F) | Avg. Water Temperature °C (°F) | Min. Water Temperature °C (°F) | |
|---|---|---|---|
| January |
22.5 72.5 |
22 71.6 |
21.1 70 |
| February |
23 73.4 |
22.8 73 |
22.5 72.5 |
| March |
22.8 73 |
22.2 72 |
21.3 70.3 |
| April |
21.3 70.3 |
20 68 |
18.3 64.9 |
| May |
18.2 64.8 |
16.8 62.2 |
15.5 59.9 |
| June |
15.4 59.7 |
13.9 57 |
12.6 54.7 |
| July |
12.6 54.7 |
11.9 53.4 |
11.3 52.3 |
| August |
12.3 54.1 |
11.9 53.4 |
11.4 52.5 |
| September |
13.9 57 |
12.9 55.2 |
12.1 53.8 |
| October |
16.4 61.5 |
15.1 59.2 |
13.7 56.7 |
| November |
19 66.2 |
17.8 64 |
16.3 61.3 |
| December |
21.3 70.3 |
20.1 68.2 |
19 66.2 |
| January | February | March | April | May | June | July | August | September | October | November | December | |
|---|---|---|---|---|---|---|---|---|---|---|---|---|
| Min. Water Temperature °C (°F) |
21.1 70 |
22.5 72.5 |
21.3 70.3 |
18.3 64.9 |
15.5 59.9 |
12.6 54.7 |
11.3 52.3 |
11.4 52.5 |
12.1 53.8 |
13.7 56.7 |
16.3 61.3 |
19 66.2 |
| Avg. Water Temperature °C (°F) |
22 71.6 |
22.8 73 |
22.2 72 |
20 68 |
16.8 62.2 |
13.9 57 |
11.9 53.4 |
11.9 53.4 |
12.9 55.2 |
15.1 59.2 |
17.8 64 |
20.1 68.2 |
| Max. Water temperature °C (°F) |
22.5 72.5 |
23 73.4 |
22.8 73 |
21.3 70.3 |
18.2 64.8 |
15.4 59.7 |
12.6 54.7 |
12.3 54.1 |
13.9 57 |
16.4 61.5 |
19 66.2 |
21.3 70.3 |
In La Barra, the annual water temperature (Atlantic Ocean) is on average 17.20°C | 62.96°F.
In February, the highest average water temperature for this place is reached with on average 23.00°C | 73.40°F. Whereas in July the lowest average water temperature is measured at 11.30°C | 52.34°F.
Approximately around February 14, the highest water temperature of around 23.00°C | 73.40°F is reached during the year. Whereas around July 31 the lowest average water temperatures are to be expected. At this time these are at about 11.30°C | 52.34°F.
The following water was used as the basis for the specified water temperatures for La Barra: Atlantic Ocean.
Airport close to La Barra
The closest Airports of La Barra are: Capitán de Corbeta Carlos A. Curbelo International Airport (PDP) 5.27km,Carrasco International Airport (MVD) 106.59km
You can reach La Barra from this Cities by Plane: São Paulo (GRU), Rio de Janeiro (GIG), Santiago (SCL), Lima (LIM), Buenos Aires (EZE), Miami (MIA), Rosario (ROS), Curitiba (CWB), Torrejón de Ardoz (MAD), Asuncion (ASU), Porto Alegre (POA)
