US9791422B2 - Analysis of periodic information in a signal - Google Patents
Analysis of periodic information in a signal Download PDFInfo
- Publication number
- US9791422B2 US9791422B2 US14/316,883 US201414316883A US9791422B2 US 9791422 B2 US9791422 B2 US 9791422B2 US 201414316883 A US201414316883 A US 201414316883A US 9791422 B2 US9791422 B2 US 9791422B2
- Authority
- US
- United States
- Prior art keywords
- waveform
- autocorrelation waveform
- autocorrelation
- periodic
- value
- Prior art date
- Legal status (The legal status is an assumption and is not a legal conclusion. Google has not performed a legal analysis and makes no representation as to the accuracy of the status listed.)
- Active, expires
Links
Images


Classifications
-
- G—PHYSICS
- G01—MEASURING; TESTING
- G01N—INVESTIGATING OR ANALYSING MATERIALS BY DETERMINING THEIR CHEMICAL OR PHYSICAL PROPERTIES
- G01N29/00—Investigating or analysing materials by the use of ultrasonic, sonic or infrasonic waves; Visualisation of the interior of objects by transmitting ultrasonic or sonic waves through the object
- G01N29/44—Processing the detected response signal, e.g. electronic circuits specially adapted therefor
- G01N29/46—Processing the detected response signal, e.g. electronic circuits specially adapted therefor by spectral analysis, e.g. Fourier analysis or wavelet analysis
-
- G—PHYSICS
- G01—MEASURING; TESTING
- G01H—MEASUREMENT OF MECHANICAL VIBRATIONS OR ULTRASONIC, SONIC OR INFRASONIC WAVES
- G01H1/00—Measuring characteristics of vibrations in solids by using direct conduction to the detector
-
- G—PHYSICS
- G01—MEASURING; TESTING
- G01N—INVESTIGATING OR ANALYSING MATERIALS BY DETERMINING THEIR CHEMICAL OR PHYSICAL PROPERTIES
- G01N29/00—Investigating or analysing materials by the use of ultrasonic, sonic or infrasonic waves; Visualisation of the interior of objects by transmitting ultrasonic or sonic waves through the object
- G01N29/44—Processing the detected response signal, e.g. electronic circuits specially adapted therefor
- G01N29/4409—Processing the detected response signal, e.g. electronic circuits specially adapted therefor by comparison
- G01N29/4427—Processing the detected response signal, e.g. electronic circuits specially adapted therefor by comparison with stored values, e.g. threshold values
-
- G—PHYSICS
- G01—MEASURING; TESTING
- G01N—INVESTIGATING OR ANALYSING MATERIALS BY DETERMINING THEIR CHEMICAL OR PHYSICAL PROPERTIES
- G01N29/00—Investigating or analysing materials by the use of ultrasonic, sonic or infrasonic waves; Visualisation of the interior of objects by transmitting ultrasonic or sonic waves through the object
- G01N29/44—Processing the detected response signal, e.g. electronic circuits specially adapted therefor
- G01N29/4454—Signal recognition, e.g. specific values or portions, signal events, signatures
-
- G—PHYSICS
- G01—MEASURING; TESTING
- G01N—INVESTIGATING OR ANALYSING MATERIALS BY DETERMINING THEIR CHEMICAL OR PHYSICAL PROPERTIES
- G01N29/00—Investigating or analysing materials by the use of ultrasonic, sonic or infrasonic waves; Visualisation of the interior of objects by transmitting ultrasonic or sonic waves through the object
- G01N29/44—Processing the detected response signal, e.g. electronic circuits specially adapted therefor
- G01N29/50—Processing the detected response signal, e.g. electronic circuits specially adapted therefor using auto-correlation techniques or cross-correlation techniques
Definitions
- This invention relates to analysis of signals. More particularly, this invention relates to methods for extracting periodic information from a vibration waveform or other signal containing periodic information.
- MTBF mean time between failures
- MTBR mean time between repairs
- Vibration analysis is a well proven technology for detecting faults in rotating machinery.
- the process of determining the severity and specifics of a fault can be very involved. Part of the analysis process involves determining whether periodic signals are present. While maintenance personnel are concerned with detailed analyses of faults, operations personnel only want to know if a problem exists. Providing a few fault-related parameters to the operator can be sufficient in accomplishing this task.
- Fault-related parameters can be related to amplitudes of energy from particular vibration frequencies (bandwidth), signal processing techniques such as PeakVueTM, and the presence of periodic signals. Parameters calculated from bandwidth and signal processing techniques are well defined. However, a parameter indicating the presence of periodic signals has not been defined.
- the ability to detect mechanical faults in industrial machinery is a task requiring skilled analytical personnel with years of training and experience. Because of budgetary and personnel constraints, a qualified analyst may be pressed to analyze most or all of the equipment in a plant. Any technology, technique or tool that can simplify the analyst's job is valuable.
- FFT Fast Fourier Transform
- identifying important peaks in an FFT plot can be difficult due to low amplitude and noise issues. The analysis could be made easier with the derivation of a graph that reflects only periodic signals present in the measurement.
- the autocorrelation coefficient function is a mathematical process that determines how much of the energy in a waveform is periodic.
- the pattern of the periodic peaks can be very helpful in identifying fault types. Recognizing these patterns and how to apply them requires an experienced analyst.
- Preferred embodiments of the present invention calculate a value that is representative of general periodic patterns, which in turn signify potential faults. This value, referred to herein as a “periodic signal parameter” (PSP), is calculated based on statistical measures derived from an autocorrelation waveform along with characteristics of the associated vibration waveform. While the PSP derived from the autocorrelation function produces an indication of periodicity and a generalization of potential fault, characteristics of the associated vibration waveform afford a measure of severity. The combination of these two identities provide further indication as to potential problems associated with machines on the plant floor. This is a significant advantage for a machine operator on the plant floor who may have little-to-no vibration analysis experience.
- the process of calculating the PSP begins with taking the autocorrelation of a vibration waveform. Once this is accomplished, several statistical calculations are performed. In a preferred embodiment, these statistical calculations include the maximum absolute waveform peak, standard deviation of the waveform, maximum absolute peak after the first 3% of the waveform, crest factor of both the waveform and positive waveform values, and a sorted mean of positive waveform peak values.
- the sorted mean is preferably calculated from a subset of values, in this case the larger set is the positive waveform peak values.
- the sorted subset preferably comprises all peak values from the positive waveform, excluding outliers. The outliers are peak values that exceed a statistically defined standard deviation about the mean. Therefore, the sorted mean is the mean value of the sorted positive waveform peak subset.
- the peak-to-peak amplitude of the initial vibration waveform (the peak amplitude in the PeakVueTM waveform) is evaluated.
- Various aspects of the PeakVueTM process are described in U.S. Pat. No. 5,895,857 (Robinson et al.), U.S. Pat. No. 6,192,325 (Piety et al.), U.S. Pat. No. 6,549,869 (Piety et al.), U.S. Pat. No. 6,889,553 (Robinson et al.), U.S. Pat. No. 7,561,200 (Garvey et al.), U.S. Pat. No.
- the base value of the PSP ranges from 0 to 1.
- Mathematical operations can be performed on the base value to achieve a desired scaling. An example would be to multiply the base value by 10 to achieve a PSP range from 0 to 10. Additionally, taking the square root of the PSP base value will accentuate variations in the lower end of the scale, which can then be multiplied by 10 to achieve a PSP range from 0 to 10.
- the PSP is calculated based on the value of the standard deviation of the autocorrelated waveform plus contributions centered on empirical observations from the other calculated statistical parameters mentioned above. Examples of autocorrelated waveforms along with the associated PSP values are provided in the detailed description.
- the PSP may apply to autocorrelated waveforms derived from filtered and unfiltered acceleration, velocity or displacement waveforms as well as processed waveforms.
- Two examples of processed waveforms are results of the PeakVueTM signal processing and demodulation techniques.
- the autocorrelation coefficient function is a mathematical process that indicates whether there is periodicity in a signal.
- periodic signals are typically evident in the data.
- FFT Fast Fourier Transform
- Preferred embodiments described herein provide a method for analyzing and displaying data to reveal periodicity in a signal.
- the embodiments include processing the raw signal using two different sets of analysis techniques, thereby producing two X-Y graphic representations of the signal data that share a common X-axis.
- a third graph is created by correlating the Y-values on the first two graphs based on the corresponding X-value.
- the amplitude of each Y-value can be derived from the two source graphs using a variety of techniques, including multiplication, taking a ratio, averaging, or keeping the maximum value.
- the resulting synthesized graph also referred to herein as a Periodic Information Plot (PIP) accentuates signal components that are pertinent to a given diagnosis while eliminating other undesired signal components. This provides for visualizing the data in a way that simplifies the recognition and quantification of desired characteristics present in the raw signal.
- the diagnosis may be accomplished either by a human or a computerized expert system. For a human analyst, the technique reduces training requirements while bringing increased efficiency and accuracy. With a computerized expert system, the technique provides new methods for diagnostic software to recognize significant patterns contained in the original signal.
- the analysis process is made easier by providing the analyst with a spectrum showing only the periodic signals present in the data. While the same periodic information is present in the original spectrum generated from the original data, it is often difficult to recognize the periodic information because the noise levels are similar in magnitude to the periodic information.
- FIG. 1 depicts a functional block diagram of a system for deriving and analyzing periodic information in a signal according to a preferred embodiment of the invention
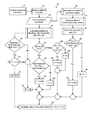
- FIG. 2 depicts a flowchart of a method for determining a periodic signal parameter according to a preferred embodiment of the invention
- FIGS. 3-7 depict exemplary autocorrelated vibration waveforms for various values of a periodic signal parameter
- FIG. 8 depicts a flowchart of a method for generating a periodic information plot according to a preferred embodiment of the invention
- FIG. 9 depicts an exemplary standard vibration spectrum
- FIG. 10 depicts an exemplary autocorrelated vibration spectrum
- FIGS. 11-17 depict periodic information plots generated according to preferred embodiments of the invention.
- FIG. 1 depicts an exemplary system 100 for deriving and analyzing periodic information in a vibration signal.
- a sensor 104 such as an accelerometer
- a machine 102 to monitor its vibration.
- an accelerometer is depicted in the exemplary embodiment of FIG. 1 , it should be appreciated that other types of sensors could be used, such as a velocity sensor, a displacement probe, an ultrasonic sensor, or a pressure sensor.
- the sensor 104 generates a vibration signal (or other type of signal for a sensor other than an accelerometer) that contains periodic information.
- the vibration signal is provided to a data collector 106 preferably comprising an analog-to-digital converter (ADC) 108 for sampling the vibration signal, a low-pass anti-aliasing filter 110 (or other type of filter), and buffer memory 112 .
- ADC analog-to-digital converter
- the data collector 106 may be a digital data recorder manufactured by TEAC or a vibration data collector.
- the vibration signal data is transferred from the data collector 106 to a periodic information processor 114 that performs the information processing tasks described herein. In an alternative embodiment, the processing tasks are performed by a processor in the data collector 106 .
- FIG. 2 depicts a flowchart of a method for calculating a periodic signal parameter (PSP) according to a preferred embodiment of the invention.
- a time-domain vibration waveform is measured, such as using the accelerometer 104 or other sensor attached to the machine 102 being monitored (step 12 ).
- An autocorrelation function is performed on the vibration waveform to determine how much of the energy in the waveform is periodic (step 14 ).
- the autocorrelation function cross-correlates the vibration waveform with itself to find repeating patterns within the waveform.
- the autocorrelation function outputs an autocorrelation waveform 16 , examples of which are depicted in FIGS. 3-7 .
- the standard deviation ( ⁇ ) the maximum absolute peak amplitude in the waveform (MaxPeak), the maximum absolute peak after the first 3% of the waveform (MaxPeak (after first 3%)), and the crest factor (CF1) (step 18 ).
- the positive waveform peaks are sorted out (step 32 ), any of those peaks that are statistically too large are discarded (step 34 ), and the mean amplitude (sorted ⁇ ) and the crest factor (CF2) of the remaining peaks are calculated (step 35 ). Methods for sorting and discarding peaks that are statistically too large are described hereinafter.
- MaxPeak is greater than or equal to 0.3 (step 20 ) and
- MaxPeak ⁇ ⁇ ( after ⁇ ⁇ first ⁇ ⁇ 3 ⁇ % ) sorted ⁇ ⁇ ⁇ ⁇ 4 , ( step ⁇ ⁇ 22 ) then Y 0.025 (step 24 ). If MaxPeak is greater than or equal to 0.3 (step 20 ) and
- MaxPeak MaxPeak ⁇ ⁇ ( after ⁇ ⁇ first ⁇ ⁇ 3 ⁇ % ) > 1 ( step ⁇ ⁇ 42 ) and ⁇ is between 0.1 and 0.9 (step 44 ), then X 0.1 (step 46 ). If
- MaxPeak MaxPeak ⁇ ⁇ ( after ⁇ ⁇ first ⁇ ⁇ 3 ⁇ % ) ⁇ 1 ( step ⁇ ⁇ 42 ) or ⁇ is not between 0.1 and 0.9 (step 44 ), then X ⁇ (step 48 ).
- the PSP is the sum of the values of X, W, Y and Z (step 50 ).
- PSP values of less than a first threshold such as 0.1
- a first threshold such as 0.1
- the algorithm for the PSP assigns a value of 0.1 to signals having low amplitude, higher frequency data. This data may also prove to be bad data.
- PSP values between first and second thresholds such as between about 0.10 and 0.14, indicate that distinct frequencies are present but there is still a significant amount of random noise.
- PSP values greater than the second threshold such as greater than about 0.14
- PSP values greater than a third threshold such as greater than 0.5 and above, indicate large dominant single frequencies in the spectrum taken from the vibration waveform. The closer the PSP value is to 1.0, the waveform has more periodic (i.e. sinusoidal) signal components and less random noise.
- a further embodiment of the present invention employs a programmable central processing unit programmed with program logic to assist a user with an interpretation of waveform information.
- the program logic compares the Periodic Signal Parameter and Stress Wave analysis information with expected or historical or empirically-derived experiential values to discern a relative ranking from low to high. Then discrete or graduated outputs, such as those portrayed in Table 1 above, are employed to select logically arrayed observations, findings, and recommendations.
- program logic In addition to evaluating PSP and Stress Wave Analysis information, program logic sometimes prompts a user to supply additional information or obtains additional information from another source such as from a knowledge base, to enable the logic to distinguish between two or more possible logical results.
- program logic that returns a high PSP and a high Stress Wave Analysis finding may select a rolling element defect finding rather than other possible findings within that category because a similarity is calculated when program logic compares a periodic frequency finding and a bearing fault frequency for a machine component identified in a knowledge base.
- Another technique to differentiate between lubrication and pump cavitation is to look at the trend of the impacting. If it increases slowly, then insufficient lubrication should be suspected. If it increases suddenly on a pump, then it is likely pump cavitation. If combined with logic or inputs on a control system, then the logic could look for process configuration changes that occurred at the same time as the increase in impacting—along with a low PSP—to confirm pump cavitation. In some embodiments, the system suggests to the operator what action caused the cavitation, so that the operator can remove the cause and stop the machine from wearing excessively and failing prematurely.
- a preferred embodiment of the invention creates a new type of vibration spectrum, referred to herein as a Periodic Information Plot (PIP).
- PIP Periodic Information Plot
- a signal is collected from plant equipment (i.e. rotating or reciprocating equipment) and is processed using two different sets of analysis techniques as depicted in FIG. 8 .
- a waveform is acquired (step 60 of FIG. 8 ), such as a vibration waveform acquired using the system depicted in FIG. 1 . If employing a high-pass filter and peak-hold decimation to an oversampled waveform to capture impacting information (such as using the PeakVueTM process), this may be a calculated waveform.
- An FFT of the waveform is taken (step 62 ), resulting in a vibration spectrum (VS) 64 with frequency on the X-axis and amplitude on the Y-axis, an example of which is shown in FIG. 9 .
- the waveform from step 60 is also autocorrelated (step 66 ) to generate a waveform referred to herein as the autocorrelation waveform 68 , having time on the X-axis and the correlation factor on the Y-axis.
- the autocorrelation process accentuates periodic components of the original waveform, while diminishing the presence of random events in the original signal.
- the associated waveform produced has half the x-axis (time) values as that of the original vibration waveform. Therefore, the timespan of the autocorrelation waveform will be half of that of the original vibration waveform.
- An optional step ( 70 ) takes the square root of the correlation factor (Y-axis values) to provide better differentiation between lower amplitude values.
- An FFT of the autocorrelation waveform is taken (step 72 ), resulting in an autocorrelation spectrum (AS) 74 . Since random events have largely been removed from the autocorrelation waveform, the remaining signal in the autocorrelation spectrum is strongly related to periodic events. As shown in FIG. 10 , the autocorrelation spectrum has frequency on the X-axis and amplitude related to the correlation factor on the Y-axis. Because the autocorrelation waveform's duration is half that of the vibration waveform, the associated autocorrelation spectrum has half the lines of resolution compared to the vibration spectrum.
- the vibration spectrum and the autocorrelation spectrum are processed to derive a graph referred to herein as the Periodic Information Plot (PIP) (step 76 ).
- PIP Periodic Information Plot
- a point-to-point comparison for values on the x-axis (frequency) between the two spectra is not possible.
- a point-to-point comparison can be made by mathematically combining the amplitude values of two x-axis values in the vibration spectrum (step 65 ) for each associated x-axis value in the autocorrelation spectrum.
- the mathematically combined amplitude values Y VS (2n) and Y VS (2n ⁇ 1) (herein termed Y MCVS (n)) associated with the X MCVS (n) value from the vibration spectrum are calculated from the amplitudes of both the X VS (2n) and X VS (2n ⁇ 1) frequencies from the x-axis.
- a second method for each X-value in the PIP (X PIP2 ), the Y-value in the PIP (Y PIP2 ) is determined by comparing the corresponding Y-value in the autocorrelation spectrum (Y AS ) to a predetermined threshold value (Y THR ). For each autocorrelation spectrum amplitude greater than this threshold value, the associated amplitude for PIP (Y PIP2 (n)) will be set to the corresponding mathematically combined value from the vibration spectrum (Y MCVS (n)). Y AS values above the predetermined threshold indicate data that is largely periodic.
- Y THR is set to only include a percentage of the largest peaks from the autocorrelation spectrum. The percentage may be calculated based on the percent periodic signal in the autocorrelation waveform. The percent periodic signal is calculated based on the autocorrelation coefficient, which is the square root of the Y-value of the largest peak in the autocorrelation waveform. For this method, only the percent periodic signal of the total number of autocorrelation spectrum peaks will be evaluated.
- Y THR is set to include only peaks with values that are within the “percent periodic signal” of the largest peak value in the autocorrelation spectrum. These peaks, along with their harmonics that appear in the autocorrelation spectrum, will be utilized as the group of peaks to be intersected with those in the vibration spectrum to form the PIP.
- An example of a PIP formed by this method is depicted in FIG. 14 .
- Some embodiments also derive a Non-periodic Information Plot (NPIP) that consists of only the Y-values of the autocorrelation spectrum that are less than a predetermined threshold (step 78 ).
- NPIP Non-periodic Information Plot
- the NPIP includes only non-periodic components.
- An example of an NPIP formed by this method is depicted in FIG. 15 .
- Some embodiments also derive a Periodicity Map from the vibration spectrum and the autocorrelation spectrum (step 82 ).
- Some embodiments also derive a Circular Information Plot from any of the Periodic Information Plots described above (step 80 ). Once a linear PIP is calculated, an inverse FFT can be applied to generate an “information waveform.” A Circular Information Plot can then be generated from this information waveform. An example of a Circular Information Plot formed by this method is depicted in FIG. 17 .
- Periodic Signal Parameters and Periodic Information Plots may be derived from any signal containing periodic components.
- the following routine takes an array of data values, such as values of positive peaks in the autocorrelation waveform, and discards values outside the statistically calculated boundaries.
- data values such as values of positive peaks in the autocorrelation waveform
- discards values outside the statistically calculated boundaries there are four methods or criteria for setting the boundaries.
- P 0 represents the number of values in the present array under evaluation.
- P ⁇ 1 represent the number of values in the array evaluated a single step before P 0
- P ⁇ 2 represent the number of values in the array evaluated a single step before P ⁇ 1
- P ⁇ 3 represent the number of values in the array evaluated a single step before P ⁇ 2 .
- the minimum boundary is set to zero.
- Step 2 would be executed instead of Step 1.
- P 0 P ⁇ 1 and P ⁇ 1 ⁇ P ⁇ 2 .
Abstract
Description
then Y=0.025 (step 24). If MaxPeak is greater than or equal to 0.3 (step 20) and
then Y=0 (step 25).
and σ is between 0.1 and 0.9 (step 44), then X=0.1 (step 46). If
or σ is not between 0.1 and 0.9 (step 44), then X=σ (step 48).
-
- The PSP provides a single number indicative of the periodic frequencies in a waveform.
- Statistical values are calculated from the autocorrelated waveform and one or more of these values are combined to produce the PSP.
- Indication of bad or noisy data is provided.
- Information about periodicity can be extracted from a large data set and broadcast via a small bandwidth protocol such as HART, wireless HART, and other similar protocols.
- The PSP value may be applied specifically to PeakVue™ data in order to distinguish between periodic and non-periodic faults, such as lubrication, cavitation, bearing, gear and rotor faults.
- The PSP value can be used in conjunction with other information to generate an indication of machine condition (i.e. nature of mechanical fault, severity of the fault). The other information may include:
- the original waveform;
- processed versions of the waveform;
- information (i.e. peak value, crest factor, kurtosis, skewness) obtained from the original vibration waveform;
- information obtained from a processed version of the original waveform (i.e. PeakVue™ processed, rectified, or demodulated waveform); and/or
- one or more rule sets.
A simple example is illustrated in Table 1 below, where derived values representing PSP output and Stress Wave Analysis output (for example, maximum peak in the PeakVue™ waveform or another derivative of PeakVue™ type analysis or another form of stress wave analysis) are used to distinguish between different types of faults. In the majority of cases, severity of the defect increases as the level of PeakVue™ impacting increases. Although the example below refers to a Stress Wave value, other embodiments may use other vibration waveform information indicative of an impacting or other fault condition.
| TABLE 1 |
| PSP and Stress Wave Analyses Outputs |
| Periodic [right] | PSP - Low | PSP - High |
| Stress Wave [below] | (PSP < PSP threshold) | (PSP > PSP threshold) |
| PeakVue ™ or other stress | No fault indication: | Early stage periodic fault related defect: |
| wave analysis - Low | no action called for | look for early indication of one of the |
| (Stress Wave value < | based on this finding | periodic fault types such as those listed |
| Stress Wave threshold) | below | |
| PeakVue ™ or other stress | Non-periodic fault: | Periodic fault: |
| wave analysis - High | look for further or | look for rolling element bearing defect or |
| (Stress Wave value > | confirming evidence of | gear defect or other source of repetitive |
| Stress Wave threshold) | inadequate lubrication or | periodic mechanical impacting - use |
| leak or contact friction or | frequency information and other information | |
| pump cavitation | to distinguish among multiple possible | |
| causes | ||
Y MCVS(n)=√{square root over ((Y VS(2n−1))2+(Y VS(2n))2)}, Eq. (0)
where n=1 . . . N and N is the number of lines of resolution found in the autocorrelation spectrum.
Y PIP1(n)=Y MCVS(n)×Y AS(n) Eq. (1)
for n=1 to N, where N is the number of X-values (frequency values) in the autocorrelation spectrum. Since amplitudes of periodic signals in the autocorrelation spectrum are higher than the amplitudes of random signals, the multiplication process will accentuate the periodic peaks while decreasing non-periodic peaks. An example of a PIP formed by the first method is depicted in
If Y AS(n)>Y THR ,Y PIP2(n)=Y MCVS(n) Eq. (2a)
If Y AS(n)≦Y THR ,Y PIP2(n)=0 (or some other default level) Eq. (2b)
for n=1 to N.
If Y PIP1(n)>Y THR ,Y PIP3(n)=Y PIP1(n) Eq. (3a)
If Y PIP1(n)≦Y THR ,Y PIP3(n)=0 (or some other default level) Eq. (3b)
for n=1 to N. An example of a PIP formed by this method is depicted in
X PM(n)=Y MCVS(n) Eq. (4a)
Y PM(n)=Y AS(n) Eq. (4b)
for n=1 to N. As shown in
| While evaluating the array of values for either the first time or P0 ≠ P−1, |
| { |
| Calculate the mean (μ) and standard deviation ( ) for P0 |
|
|
| Include array values such that |
| μ − n < values < μ + n |
| Else |
| STOP, values are within statistical boundaries. |
| Endif |
| } |
| If P0 = P−1, then | |||
| While P−1 ≠ P−2, and P0 = P−1 | |||
| { | |||
| Calculate the mean (μ) and standard deviation ( ) for P0 | |||
|
|
|||
| Include array values such that | |||
|
|
|||
| Else | |||
| STOP, values are within statistical boundaries. | |||
| Endif | |||
| } | |||
| Endif | |||
| If P0 = P−1 = P−2, and P−2 ≠ P−3, then | ||
| Calculate the mean (μ) and standard deviation (σ) for P0 | |
| Include array values such that | |
| 0.9μ < values < 1.1μ |
| Else |
| STOP, values are within statistical boundaries. |
| Endif | ||
| TABLE 2 |
| 0.953709 |
| 0.828080 |
| 0.716699 |
| 0.653514 |
| 0.612785 |
| 0.582031 |
| 0.579209 |
| 0.557367 |
| 0.545801 |
| 0.495215 |
| 0.486426 |
| 0.486053 |
| 0.475123 |
| 0.472348 |
| 0.467129 |
| 0.465488 |
| 0.446327 |
| 0.440497 |
| 0.437959 |
| 0.427256 |
| 0.411627 |
Since 0.25442 is greater than 0.1, calculate
μ−nσ=0.54955−1*0.13982=0.409735
and
μ+nσ=0.54955+1*0.13982=0.689373.
| TABLE 3 |
| 0.653514 |
| 0.612785 |
| 0.582031 |
| 0.579209 |
| 0.557367 |
| 0.545801 |
| 0.495215 |
| 0.486426 |
| 0.486053 |
| 0.475123 |
| 0.472348 |
| 0.467129 |
| 0.465488 |
| 0.446327 |
| 0.440497 |
| 0.437959 |
| 0.427256 |
| 0.411627 |
μ=0.50234,
σ=0.06946,
σ/μ=0.138263,
μ+σ=0.571797, and
μ−σ=0.432887.
| TABLE 4 |
| 0.557367 |
| 0.545801 |
| 0.495215 |
| 0.486426 |
| 0.486053 |
| 0.475123 |
| 0.472348 |
| 0.467129 |
| 0.465488 |
| 0.446327 |
| 0.440497 |
| 0.437959 |
μ=0.481311,
σ=0.037568, and
σ/μ=0.078053.
Since
σ/μ=0.078053≦0.1,
all the members of the array P0 are statistically close in value and need no more sorting.
Claims (9)
Priority Applications (4)
| Application Number | Priority Date | Filing Date | Title |
|---|---|---|---|
| US14/316,883 US9791422B2 (en) | 2013-07-02 | 2014-06-27 | Analysis of periodic information in a signal |
| US15/697,911 US10416126B2 (en) | 2013-07-02 | 2017-09-07 | Machine fault prediction based on analysis of periodic information in a signal |
| US16/515,793 US11002641B2 (en) | 2013-07-02 | 2019-07-18 | System for separating periodic amplitude peaks from non-periodic amplitude peaks in machine vibration data |
| US17/227,271 US11635345B2 (en) | 2013-07-02 | 2021-04-10 | System for separating periodic frequency of interest peaks from non-periodic peaks in machine vibration data |
Applications Claiming Priority (2)
| Application Number | Priority Date | Filing Date | Title |
|---|---|---|---|
| US201361842035P | 2013-07-02 | 2013-07-02 | |
| US14/316,883 US9791422B2 (en) | 2013-07-02 | 2014-06-27 | Analysis of periodic information in a signal |
Related Child Applications (1)
| Application Number | Title | Priority Date | Filing Date |
|---|---|---|---|
| US15/697,911 Continuation-In-Part US10416126B2 (en) | 2013-07-02 | 2017-09-07 | Machine fault prediction based on analysis of periodic information in a signal |
Publications (2)
| Publication Number | Publication Date |
|---|---|
| US20150012247A1 US20150012247A1 (en) | 2015-01-08 |
| US9791422B2 true US9791422B2 (en) | 2017-10-17 |
Family
ID=52133389
Family Applications (1)
| Application Number | Title | Priority Date | Filing Date |
|---|---|---|---|
| US14/316,883 Active 2036-03-01 US9791422B2 (en) | 2013-07-02 | 2014-06-27 | Analysis of periodic information in a signal |
Country Status (1)
| Country | Link |
|---|---|
| US (1) | US9791422B2 (en) |
Cited By (6)
| Publication number | Priority date | Publication date | Assignee | Title |
|---|---|---|---|---|
| US20160301991A1 (en) * | 2015-04-08 | 2016-10-13 | Itt Manufacturing Enterprises Llc. | Nodal dynamic data acquisition and dissemination |
| DE102019106903A1 (en) | 2018-04-05 | 2019-10-10 | Computational Systems, Inc. | Determination of the engine speed on the basis of vibration spectral diagrams |
| US11002641B2 (en) * | 2013-07-02 | 2021-05-11 | Computational Systems, Inc. | System for separating periodic amplitude peaks from non-periodic amplitude peaks in machine vibration data |
| DE102021129508A1 (en) | 2021-04-10 | 2022-10-13 | Computational Systems, Inc. | SYSTEM FOR SEPARATING PERIODIC PEAKS OF FREQUENCY OF INTEREST FROM NON- PERIODIC PEAKS IN MACHINE VIBRATION DATA |
| US11499889B1 (en) | 2021-09-10 | 2022-11-15 | Computational Systems, Inc. | Fault frequency matching of periodic peaks in spectral machine data |
| US11573153B2 (en) | 2019-08-21 | 2023-02-07 | Computational Systems, Inc. | Prediction of machine failure based on vibration trend information |
Families Citing this family (8)
| Publication number | Priority date | Publication date | Assignee | Title |
|---|---|---|---|---|
| US11635345B2 (en) | 2013-07-02 | 2023-04-25 | Computational Systems, Inc. | System for separating periodic frequency of interest peaks from non-periodic peaks in machine vibration data |
| US10259572B2 (en) * | 2015-04-16 | 2019-04-16 | Bell Helicopter Textron Inc. | Torsional anomalies detection system |
| DE102017124135B4 (en) | 2016-10-21 | 2023-06-07 | Computational Systems Inc. | Machine failure prediction based on an analysis of periodic information in a signal |
| US10151767B2 (en) * | 2017-02-07 | 2018-12-11 | Computational Systems Inc. | Laser strobe tachometer |
| US11754592B1 (en) * | 2019-02-06 | 2023-09-12 | Gpms International, Inc. | System for detecting peaks in vibrational energy spectra |
| DE102019127211A1 (en) * | 2019-03-05 | 2020-09-10 | Computational Systems, Inc. | System for separating periodic amplitude peaks from non-periodic amplitude peaks in machine vibration data |
| US11300482B2 (en) | 2019-08-06 | 2022-04-12 | Computational Systems, Inc. | Graphical differentiation of spectral frequency families |
| CN114544188B (en) * | 2022-02-22 | 2023-09-22 | 中国航发沈阳发动机研究所 | Vibration fluctuation fault identification and elimination method caused by multisource beat vibration of aero-engine |
Citations (12)
| Publication number | Priority date | Publication date | Assignee | Title |
|---|---|---|---|---|
| US5895857A (en) | 1995-11-08 | 1999-04-20 | Csi Technology, Inc. | Machine fault detection using vibration signal peak detector |
| US5943634A (en) | 1996-05-14 | 1999-08-24 | Csi Technology, Inc. | Vibration data analysis based on time waveform parameters |
| US6408696B1 (en) | 1999-12-06 | 2002-06-25 | Ai Signal Research, Inc. | Coherent phase line enhancer spectral analysis technique |
| US6651012B1 (en) | 2001-05-24 | 2003-11-18 | Simmonds Precision Products, Inc. | Method and apparatus for trending and predicting the health of a component |
| US7010445B2 (en) | 2002-01-23 | 2006-03-07 | Csi Technology, Inc. | Automated fault diagnosis device and method |
| US7133801B2 (en) | 2002-06-07 | 2006-11-07 | Exxon Mobil Research And Engineering Company | System and methodology for vibration analysis and condition monitoring |
| US7136794B1 (en) | 2001-05-24 | 2006-11-14 | Simmonds Precision Products, Inc. | Method and apparatus for estimating values for condition indicators |
| US7194383B2 (en) | 2004-12-06 | 2007-03-20 | Caterpillar Inc | Vibration analysis system and method for a machine |
| EP1097363B1 (en) | 1998-07-15 | 2007-12-12 | Abb Research Ltd. | Bearing condition evaluation |
| US20110098968A1 (en) | 2009-10-26 | 2011-04-28 | Srinivasa Ramesh B | System and method for vibration analysis and phase analysis of vibration waveforms using dynamic statistical averaging of tachometer data to accurately calculate rotational speed |
| US8174402B2 (en) * | 2005-01-31 | 2012-05-08 | Csi Technology, Inc. | Machine condition indication system |
| WO2012172369A2 (en) | 2011-06-15 | 2012-12-20 | Romax Technology Limited | Vibration monitoring |
-
2014
- 2014-06-27 US US14/316,883 patent/US9791422B2/en active Active
Patent Citations (12)
| Publication number | Priority date | Publication date | Assignee | Title |
|---|---|---|---|---|
| US5895857A (en) | 1995-11-08 | 1999-04-20 | Csi Technology, Inc. | Machine fault detection using vibration signal peak detector |
| US5943634A (en) | 1996-05-14 | 1999-08-24 | Csi Technology, Inc. | Vibration data analysis based on time waveform parameters |
| EP1097363B1 (en) | 1998-07-15 | 2007-12-12 | Abb Research Ltd. | Bearing condition evaluation |
| US6408696B1 (en) | 1999-12-06 | 2002-06-25 | Ai Signal Research, Inc. | Coherent phase line enhancer spectral analysis technique |
| US6651012B1 (en) | 2001-05-24 | 2003-11-18 | Simmonds Precision Products, Inc. | Method and apparatus for trending and predicting the health of a component |
| US7136794B1 (en) | 2001-05-24 | 2006-11-14 | Simmonds Precision Products, Inc. | Method and apparatus for estimating values for condition indicators |
| US7010445B2 (en) | 2002-01-23 | 2006-03-07 | Csi Technology, Inc. | Automated fault diagnosis device and method |
| US7133801B2 (en) | 2002-06-07 | 2006-11-07 | Exxon Mobil Research And Engineering Company | System and methodology for vibration analysis and condition monitoring |
| US7194383B2 (en) | 2004-12-06 | 2007-03-20 | Caterpillar Inc | Vibration analysis system and method for a machine |
| US8174402B2 (en) * | 2005-01-31 | 2012-05-08 | Csi Technology, Inc. | Machine condition indication system |
| US20110098968A1 (en) | 2009-10-26 | 2011-04-28 | Srinivasa Ramesh B | System and method for vibration analysis and phase analysis of vibration waveforms using dynamic statistical averaging of tachometer data to accurately calculate rotational speed |
| WO2012172369A2 (en) | 2011-06-15 | 2012-12-20 | Romax Technology Limited | Vibration monitoring |
Cited By (7)
| Publication number | Priority date | Publication date | Assignee | Title |
|---|---|---|---|---|
| US11002641B2 (en) * | 2013-07-02 | 2021-05-11 | Computational Systems, Inc. | System for separating periodic amplitude peaks from non-periodic amplitude peaks in machine vibration data |
| US20160301991A1 (en) * | 2015-04-08 | 2016-10-13 | Itt Manufacturing Enterprises Llc. | Nodal dynamic data acquisition and dissemination |
| US10271115B2 (en) * | 2015-04-08 | 2019-04-23 | Itt Manufacturing Enterprises Llc. | Nodal dynamic data acquisition and dissemination |
| DE102019106903A1 (en) | 2018-04-05 | 2019-10-10 | Computational Systems, Inc. | Determination of the engine speed on the basis of vibration spectral diagrams |
| US11573153B2 (en) | 2019-08-21 | 2023-02-07 | Computational Systems, Inc. | Prediction of machine failure based on vibration trend information |
| DE102021129508A1 (en) | 2021-04-10 | 2022-10-13 | Computational Systems, Inc. | SYSTEM FOR SEPARATING PERIODIC PEAKS OF FREQUENCY OF INTEREST FROM NON- PERIODIC PEAKS IN MACHINE VIBRATION DATA |
| US11499889B1 (en) | 2021-09-10 | 2022-11-15 | Computational Systems, Inc. | Fault frequency matching of periodic peaks in spectral machine data |
Also Published As
| Publication number | Publication date |
|---|---|
| US20150012247A1 (en) | 2015-01-08 |
Similar Documents
| Publication | Publication Date | Title |
|---|---|---|
| US9791422B2 (en) | Analysis of periodic information in a signal | |
| US10416126B2 (en) | Machine fault prediction based on analysis of periodic information in a signal | |
| US11002641B2 (en) | System for separating periodic amplitude peaks from non-periodic amplitude peaks in machine vibration data | |
| US10725439B2 (en) | Apparatus and method for monitoring a device having a movable part | |
| CN107976304B (en) | The mechanical disorder prediction analyzed based on the periodical information to signal | |
| Wang et al. | Support vector data description for fusion of multiple health indicators for enhancing gearbox fault diagnosis and prognosis | |
| CN111664929B (en) | System for separating periodic amplitude peaks and non-periodic amplitude peaks in machine vibration data | |
| US11635345B2 (en) | System for separating periodic frequency of interest peaks from non-periodic peaks in machine vibration data | |
| Lebold et al. | Review of vibration analysis methods for gearbox diagnostics and prognostics | |
| US9091588B2 (en) | System and method of mechanical fault detection based on signature detection | |
| TWI460416B (en) | Method and apparatus for judging status of mechanic system | |
| Jablonski et al. | Modeling of probability distribution functions for automatic threshold calculation in condition monitoring systems | |
| KR20130065621A (en) | Abnormality detection apparatus for periodic driving system, processing apparatus including periodic driving system, abnormality detection method for periodic driving system, and computer program | |
| US10311703B1 (en) | Detection of spikes and faults in vibration trend data | |
| US20190228636A1 (en) | Vibrational analysis systems and methods | |
| TWI447371B (en) | Real-time detection system and the method thereof | |
| Jaber et al. | Development of a Condition Monitoring Algorithm for Industrial Robots based on Artificial Intelligence and Signal Processing Techniques. | |
| JP6801131B1 (en) | Diagnostic equipment, diagnostic methods, and diagnostic programs | |
| WO2008035611A1 (en) | Data processing device, data processing method, and data processing program | |
| CN117272210A (en) | Method and system for detecting abnormal hidden danger data of building construction | |
| KR101543146B1 (en) | Method for estimating state of vibration machine | |
| JP2016031307A (en) | Signal processing method and signal processing device | |
| Amer et al. | Machine tool condition monitoring using sweeping filter techniques | |
| JP7415850B2 (en) | Structural abnormality diagnosis device and structural abnormality diagnosis method | |
| JP4049331B2 (en) | Method and apparatus for evaluating diagnostic object |
Legal Events
| Date | Code | Title | Description |
|---|---|---|---|
| AS | Assignment |
Owner name: CSI TECHNOLOGY, INC., DELAWARE Free format text: ASSIGNMENT OF ASSIGNORS INTEREST;ASSIGNORS:BOWERS, STEWART V., III;SKEIRIK, ROBERT D.;SIGNING DATES FROM 20140623 TO 20140625;REEL/FRAME:033193/0288 |
|
| AS | Assignment |
Owner name: COMPUTATIONAL SYSTEMS, INC., TENNESSEE Free format text: ASSIGNMENT OF ASSIGNORS INTEREST;ASSIGNOR:CSI TECHNOLOGY, INC.;REEL/FRAME:034716/0119 Effective date: 20141229 |
|
| STCF | Information on status: patent grant |
Free format text: PATENTED CASE |
|
| MAFP | Maintenance fee payment |
Free format text: PAYMENT OF MAINTENANCE FEE, 4TH YEAR, LARGE ENTITY (ORIGINAL EVENT CODE: M1551); ENTITY STATUS OF PATENT OWNER: LARGE ENTITY Year of fee payment: 4 |