US5774213A - Techniques for measuring difference of an optical property at two wavelengths by modulating two sources to have opposite-phase components at a common frequency - Google Patents
Techniques for measuring difference of an optical property at two wavelengths by modulating two sources to have opposite-phase components at a common frequency Download PDFInfo
- Publication number
- US5774213A US5774213A US08/518,427 US51842795A US5774213A US 5774213 A US5774213 A US 5774213A US 51842795 A US51842795 A US 51842795A US 5774213 A US5774213 A US 5774213A
- Authority
- US
- United States
- Prior art keywords
- sample
- sources
- signal
- component
- wavelength
- Prior art date
- Legal status (The legal status is an assumption and is not a legal conclusion. Google has not performed a legal analysis and makes no representation as to the accuracy of the status listed.)
- Expired - Fee Related
Links
Images


Classifications
-
- G—PHYSICS
- G01—MEASURING; TESTING
- G01N—INVESTIGATING OR ANALYSING MATERIALS BY DETERMINING THEIR CHEMICAL OR PHYSICAL PROPERTIES
- G01N21/00—Investigating or analysing materials by the use of optical means, i.e. using sub-millimetre waves, infrared, visible or ultraviolet light
- G01N21/17—Systems in which incident light is modified in accordance with the properties of the material investigated
- G01N21/25—Colour; Spectral properties, i.e. comparison of effect of material on the light at two or more different wavelengths or wavelength bands
- G01N21/31—Investigating relative effect of material at wavelengths characteristic of specific elements or molecules, e.g. atomic absorption spectrometry
- G01N21/314—Investigating relative effect of material at wavelengths characteristic of specific elements or molecules, e.g. atomic absorption spectrometry with comparison of measurements at specific and non-specific wavelengths
- G01N21/3151—Investigating relative effect of material at wavelengths characteristic of specific elements or molecules, e.g. atomic absorption spectrometry with comparison of measurements at specific and non-specific wavelengths using two sources of radiation of different wavelengths
Definitions
- the present invention relates generally to optical spectroscopy, and more specifically to a spectrophotometer suitable for performing non-invasive measurement of metabolic analytes and for determining characteristics of substances in the solid, liquid, and gas phases in other, e.g. industrial settings.
- These diagnostic techniques involve measuring the absorbance, scatter, transmission, or reflection spectra of living tissue non-invasively, and hence conveniently and painlessly.
- optical diagnostics exist or are under active development for measuring a wide variety of important metabolic quantities, including oxygen saturation of hemoglobin, body fat, cholesterol, triglycerides, bilirubin, and glucose.
- similar optical diagnostic techniques are important in agriculture, semiconductor processing, petroleum processing and refining, combustion diagnostics and other fields.
- Chemometrics is a class of sophisticated mathematical algorithms that reduce large spectral calibration matrices to a mathematical model that can be applied to new spectral data to determine the concentrations of various constituent analytes. Commonly used chemometric algorithms include: partial least squares (PLS), multiple linear regression (MLR), and principal component regression (PCR).
- PLS partial least squares
- MLR multiple linear regression
- PCR principal component regression
- another method involves the use of neural networks. This latter method is especially useful when nonlinear behavior occurs, and the linearity assumption of chemometrics is no longer valid.
- spectrophotometers fall into two general classes, (1) those designed for general optical spectroscopy and (2) those designed specifically for non-invasive clinical applications.
- the devices in the first class include both Fourier-transform spectrometers (FTS's) and frequency-domain grating-tuned spectrophotometers (GTS's). Both these types of instruments are engineered for maximal sensitivity and high resolution, and hence they are quite costly.
- FTS Fourier-transform spectrometers
- GTS's frequency-domain grating-tuned spectrophotometers
- GTS's are also finely tuned instruments with high resolution determined by precisely scanning (to less than a microradian) a finely ruled diffraction grating. As a result, high-resolution GTS's will undoubtedly remain expensive as well. In addition, due to their need for precise alignment, both of these devices tend to be heavy and not portable.
- the second class of spectrophotometers which will be referred to as "portable" spectrophotometers, offer only limited spectral resolution and hence typically only involve measurements at a modest number of wavelengths. See, for example, U.S. Pat. No. 5,028,787 to Rosenthal et al. Such devices are useful for specific diagnostic analyses, generally of a solid or liquid-phase sample, in which only low resolution is required, and typically, the number of required wavelengths is limited and often known in advance. These devices typically require less than 1/1000th the resolution of the general-spectroscopic class of spectrophotometers. Indeed, simple portable devices that measure the most strongly absorbing quantities in tissue, such as the oxidation of hemoglobin, require as few as two wavelength measurements and are in fact inexpensive.
- spectrophotometers tend to vary from measurement to measurement due to drifts associated with the sources, electronics, and detector within the instrument. Specifically, two spectra taken only seconds apart in an unchanging medium may have similar spectral characteristics, but are typically offset somewhat relative to each other. Consequently, one spectrum will appear slightly more (or less) absorbing than another at all wavelengths. Similarly, there often occur slow baseline shifts across a single spectrum. Uncorrected, the use of such baseline-shifted spectra generally yields erroneous or poor quality results. Such instrument drifts therefore limit sensitivity and hence the diagnostic power of the technique. The only devices for which source drift is not a serious limitation are FTS's, but, as mentioned, their alignment-sensitivity, weight, and high cost make them unsuitable for small-scale medical, clinical, quality-control, or regulatory applications.
- the useful information contained in a spectrum is unaffected by these transformations, but the noise associated with the individual wavelength measurements increases with each higher order of derivative. This is because the derivative is a difference between approximately equal adjacent spectral values, and each time such a difference is computed, the noise increases significantly. It would be much better to somehow measure the first or second derivative directly as a single measurement, and not as a difference between two measurements (as in the first derivative) or worse, as a difference of differences (as in the second derivative).
- the derivative spectra are computed, and not measured directly: the transmissions measured at all wavelengths are digitized, and the differences are computed digitally.
- this method has limited sensitivity due to noise in each measurement and the quantization error in the digitization. If, for example, an analog-to-digital converter (ADC) has 14 bits (that is, about 0.01% accuracy) and the difference between the transmissions at neighboring wavelengths is about 0.01%, then the error in the derivative measurements is on the order of 100%. Measurements of the second derivative are even more problematic, and, in this example, would be meaningless.
- ADC analog-to-digital converter
- the present invention provides a technique for making precise spectrophotometric measurements suitable for use in connection with non-invasive monitoring of human metabolic analytes and industrial products.
- the invention achieves low cost and very high sensitivity while allowing the extraction of nearly drift-free derivative spectra using only a single detector. Derivative measurements are made at all wavelengths simultaneously and without the need to compute a difference.
- the invention contemplates illuminating a sample with two or more independently modulated light sources at two or more, typically closely spaced, wavelengths.
- Light from the sources is combined, homogenized, and directed to the sample, and the light from the sample is collected and detected by a photodetector.
- the light from the sample may be reflected, transmitted, or scattered.
- the optical output powers of two sources, typically adjacent in wavelength are modulated with the same periodicity and with a reversed amplitude (opposite sign) so as to have a common frequency component at an electrical frequency, but with opposite-phase AC intensity components for the two sources.
- Variations in the concentrations of species in the sample affect the modulation amplitude representing the sum of the optical powers from two sources in such a way as to produce an output signal. That output signal, based on an electrical component varying with a periodicity at the fundamental frequency, provides a measure of the difference in the transmissions (or other optical properties) of the sample at the two wavelengths. From one such two-wavelength measurement the relative concentration of one species can be measured (in the absence of interfering species). In principle, each additional wavelength allows one additional species to be measured.
- the invention recognizes that medical and industrial diagnostics require high sensitivity but typically without the requirement of high resolution (since solid- and liquid-phase absorptions are inherently spectrally broad).
- the invention is able to combine a number of techniques that have previously been regarded as inappropriate in the context of spectrophotometers. These techniques, which include instantaneous background subtraction and derivative measurement, phase-sensitive detection, null-point detection and frequency-division multiplexing, provide low-cost, high-sensitivity, low-noise, low-drift spectral measurements.
- FIG. 1 is a schematic of an embodiment of the invention using two sources and no feedback
- FIG. 2A shows plots of optical power at the two wavelengths and the total optical power before the light encounters the sample
- FIG. 2B shows plots of optical power at the two wavelengths and the total optical power after the light encounters the sample
- FIG. 3 is a schematic of an embodiment of the invention, which uses negative feedback to equalize the optical power of the two sources;
- FIG. 4 is a schematic of an embodiment which uses negative feedback to null the residual modulation of the light from the sample
- FIG. 5 is a schematic of an embodiment which switches the negative feedback between the regimes shown in FIGS. 3 and 4;
- FIG. 6 is a schematic of an embodiment corresponding to that of FIG. 4, extended to provide N difference measurements through the use of 2N sources;
- FIG. 7 is a schematic of an embodiment corresponding to that of FIG. 4, extended to provide N difference measurements through the use of (N+1) sources;
- FIG. 8 is a schematic of an embodiment corresponding to that of FIG. 3, extended to provide N difference measurements through the use of (N+1) sources;
- FIG. 9 is a schematic of a multi-wavelength embodiment with feedback utilizing a digital-signal-processor (DSP) chip (or other microprocessor) to perform all functions, including chemometrics, digitally; and
- DSP digital-signal-processor
- FIG. 10 is a schematic of an alternative tunable light source utilizing a graded interference filter which makes the two-wavelength null-point technique work as a first derivative spectrometer.
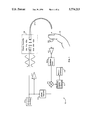
- FIG. 1 is an optical and electrical schematic of a system 10 according to a first embodiment of the invention.
- the purpose of the system is to determine the difference in the transmission (or other optical property) of light at two wavelengths on encountering a sample, shown as a human finger 15.
- first and second amplitude modulated sources 20a and 20b which in the specific embodiment are light-emitting diodes (LEDs).
- LEDs 20a and 20b Light from LEDs 20a and 20b is directed through respective lenses 22a and 22b and through respective filters 25a and 25b to a beam homogenizer 27.
- the combination of sources, filters, and lenses can be considered a source assembly 28.
- the need for filters depends on the bandwidth of the sources and the wavelength separation of the two sources.
- a typical wavelength spacing is on the order of 5-10 nm. Since LEDs typically have a bandwidth on the order of 20 nm, the filters should have respective bandpass widths on the order of 5-10 nm.
- Laser diodes may also be used, and, due to their narrower bandwidth (say less than 0.1 nm), would not need to be used in conjunction with filters. It would be necessary to choose the proper laser diode wavelengths. There may be some applications where the wavelengths are sufficiently separated that filters are not necessary, even if LEDs are used.
- LEDs that operate at room temperature are available in the visible and near infrared ranges, most commonly in the 600-1000 nm range and at wavelengths of 1300 nm and 1550 nm, the latter two wavelengths being in wide use in fiber optic communication systems.
- the light from the homogenizer encounters the sample, and is detected by a photodetector 30.
- the photodetector transforms optical power to an electrical signal (voltage or current), which is amplified by a preamplifier 40.
- Amplitude modulation of the sources is effected by an oscillator 45, having a fundamental frequency ⁇ , typically in the range from 1 kHz to 1 MHz.
- the oscillator drives source 20a with a modulation of one phase and drives source 20b through an inverting amplifier 47 to provide modulation with the opposite phase.
- the waveforms representing each of the signals are shown schematically along their respective signal lines.
- the two sources are driven with respective average powers, P 1 and P 2 and modulation powers ⁇ P 1 and ⁇ P 2 .
- the power of source 20a is P 1 - ⁇ P 1 cos( ⁇ t) while that of source 20b is P 2 + ⁇ P 2 cos( ⁇ t)), whereupon the total power is
- T( ⁇ 1 ) be the transmission of the medium at ⁇ 1
- T( ⁇ 2 ) be the transmission of the medium at ⁇ 2 .
- the modulated term i.e., the term proportional to cos( ⁇ t)
- T'( ⁇ ) is proportional to the desired quantity
- T'( ⁇ ) the other factors in this term are easily measured.
- the extent of the modulation therefore provides a measure of the desired transmission difference.
- the phase of the modulation of the transmitted light provides the sign of transmission differences, which can be positive or negative.
- An output signal representing this difference is generated using phase-sensitive detection.
- the signal from preamplifier 40 is filtered by a bandpass filter 50 and mixed at a mixer 52 with a local oscillator signal derived from oscillator 45.
- the phase of the local oscillator signal is adjusted by a phase adjuster 55.
- Filter 50 suppresses all frequency components in the photodetector signal except the one at the fundamental, ⁇ , which is converted to DC by mixer 52. This output signal is measured and constitutes a point in the derivative spectrum.
- the signal may be output to a meter or converted to digital form by an analog-to-digital converter 57 and communicated to a processor 58 for further processing.
- a processor 58 for further processing.
- the meter or analog-to-digital converter and processor will not be illustrated, but it is to be understood that they will typically be present.
- FIG. 3 is an optical and electrical schematic of a system 60 according to a further embodiment of the invention. Elements corresponding to those in FIG. 1 are denoted with the same reference numerals. This embodiment uses feedback to maintain equal modulation amplitudes for the power of the two sources.
- the apparatus includes the elements of the first embodiment, but includes additional elements as follows. Further, the inverting amplifier has a gain adjustment input, and is denoted by reference numeral 62.
- a beamsplitter 65 intercepts the light emerging from beam homogenizer 27, and splits the light into two beams. One beam (comprising most of the light) passes through sample 15, and the other beam (comprising a few percent of the light) is used to generate a control signal for a servo loop. The difference in the two beam intensities is intended to compensate for the fact that the sample (here a finger) attenuates its beam.
- the additional elements include a photodetector 70, a preamplifier 71, a bandpass filter 72, and a mixer 75, which produce a signal proportional to the residual modulation of the light before it encounters the sample. This signal is fed back by a servo amplifier 80 to the gain adjustment input of inverting amplifier 62.
- the output of mixer 52 provides the desired information regarding the sample as in the embodiment of FIG. 1, with the servo control ensuring that the residual modulation in the light after it penetrates the sample does not contain any contribution due to an inequality of the modulation amplitudes of the sources.
- the error signal can be nulled by feeding back to either of the complementary light sources or to both sources differentially.
- FIG. 4 is an optical and electrical schematic of a system 90 according to a further embodiment of the invention. Elements corresponding to those in FIG. 1 are denoted with the same reference numerals.
- the sources are modulated so that the light leaving the sample has minimal residual modulation at the fundamental frequency.
- the imbalance in the modulation of the two sources represents the difference in the optical property of the sample at the two wavelengths.
- This embodiment differs from the embodiment of FIG. 1 in that the output from mixer 52 is used as an error signal instead of the output signal containing the desired information.
- This error signal is used to impose a difference in the modulated intensities of the two sources in a manner tending to null out the fundamental component in the detector signal.
- the output from mixer 52 is communicated to servo amplifier 80, whose output is communicated to the gain adjustment input of inverting amplifier 62.
- the output from the servo amplifier now represents the desired transmission difference of the sample at the two source wavelengths.
- FIG. 5 is an optical and electrical schematic of a system 120 according to an embodiment in the error signal is alternately switched by a switch 122 between one signal derived from the light detected directly (as in FIG. 3) and another signal derived from the detector monitoring the light that probes the sample (as shown in FIG. 4).
- the control loop closes alternately around the signal from source monitor detector 70 and the signal from sample detector 30. Both configurations are described in the above description of the two previous embodiments.
- the control signal at the output of the servo amplifier 80 provides the output signal from which the spectral data are derived.
- the gain of the servo amplifier 80 may also be switched simultaneously with the signals to compensate for the differing signal strengths due to changes in the optical attenuation of the sample and differences in the beamsplitter efficiencies.
- the advantage of combining both embodiments in this way is that the time-varying effects of drifts associated with the sources can be compensated in real time.
- the same microprocessor used for signal analysis would be well-suited for controlling the switching between signals as well as for servo gain control.
- the frequency of switching between source monitoring and sample monitoring will depend on the time scales of the variations of the signal and the drifts of the sources.
- the optimal switching frequency is slower than the modulation frequency of the sources, yet faster than any variations of the sources or the sample. For example, if the technique were used in an application where the signal is modulated with the heart pulse (as in pulse oximetry) the switching frequency would be faster than that pulsatile frequency.
- the above embodiments provide a measurement of a spectral derivative at a single wavelength.
- the technique described for the above embodiments is readily extendible to more than a single difference measurement.
- a spectrophotometer is a device that measures an optical property, such as transmittance or reflectance, as a function of wavelength.
- an optical property such as transmittance or reflectance
- Each of the embodiments described above can be applied in the form of a spectrophotometer by replacing its source assembly with sources that range, or can be tuned, over a broad wavelength range.
- a mathematical model or chemometric calibration and analysis of the raw spectra are typically used for extraction of concentration data.
- FIG. 6 is a schematic of a system 140 that extends system 90 of FIG. 4 to a system suitable for providing a plurality of N difference measurements.
- N is unlikely to exceed 30-40, and is more likely to be less than about 10.
- the system includes 2N sources (N pairs) and associated electronics for each pair. Each pair is modulated at a respective one of N fundamental frequencies. A single detector and preamplifier are used. This is a type of frequency division multiplexing and achieves simultaneous measurement at all wavelengths.
- the figure shows four such pairs of sources and the associated electronics for two of the sources. Elements corresponding to those in FIG. 4 have the same reference numerals, but the reference numerals for the replicated elements are provided with a letter suffix.
- the spacing of the two wavelengths within a pair and the spacing of the N wavelength pairs from each other tend to be a function of the wavelength range of interest and the availability of sources. As a practical matter, it is not always possible to have the same wavelength spacing for all the pairs, nor is it always possible to uniformly span a wavelength range of interest.
- Each of the N pairs of complementary sources is modulated at an independent one of the N fundamental electrical frequencies, and the combined light is homogenized and used to illuminate the sample.
- the Fourier component at each fundamental frequency is detected and provides a signal yielding one of the multiple difference measurements.
- all frequency components of the detected optical power are effectively nulled making the detected power virtually constant.
- a single detector simultaneously measures all the signals at all the different fundamental frequencies. This approach provides for continuous monitoring of the measured quantity in real time through frequency division multiplexing.
- Both sources of a given complementary pair are situated at nearby but distinct wavelengths.
- the signal from preamplifier 40 is filtered at N fundamental frequencies and each respective frequency component is demodulated using phase-sensitive detection. Each demodulated signal is fed back to suppress the contribution to the total optical power from its respective pair of sources.
- the measurements at the outputs of the servo amplifiers represent the spectral data at the mean wavelength of each complementary pair. For a large number of sources the spectrum approximates the first derivative spectrum.
- FIG. 7 is a schematic of a system 150 that extends system 90 of FIG. 4 to one that provides N difference measurements with only (N+1) sources.
- (N+1) sources at (N+1) generally evenly spaced wavelengths are used to measure a first derivative spectrum at N mean wavelengths. If the wavelength spacings are not uniform, the actual spacings can be used to calibrate the measured derivatives. If the wavelength spacings are highly non-uniform, the results will not yield derivatives, but will still contain useful spectral information.
- Each source excluding the first and last, is modulated at two fundamental electrical frequencies simultaneously.
- the signals from oscillators 45a and 45b are added electronically by a summing amplifier 90ab, the signals from oscillators 45b and 45c are added by a summing amplifier 90bc, etc., before driving their respective sources.
- one of each pair of modulation signals at a given frequency is inverted and modified by adjusting the output of inverting amplifiers 62a and 62b.
- N fundamental frequencies ⁇ 1 , ⁇ 2 , . . . ⁇ N There are N fundamental frequencies ⁇ 1 , ⁇ 2 , . . . ⁇ N .
- the figure shows circuitry for modulating the first source at fundamental frequency ⁇ 1 , the second source at fundamental frequencies ⁇ 1 and ⁇ 2 , and the third source at fundamental frequencies ⁇ 2 and ⁇ 3 .
- the last, or (N+1)th, source (not shown) is modulated only at the fundamental frequency ⁇ N .
- the detection circuitry for three difference measurements and the servos for two of the measurements.
- This approach uses one more than half the number of sources as the previous embodiment. Since a large part of the cost of such an instrument is in the source and filter assembly, a substantial cost can be saved in this configuration.
- FIG. 8 is a schematic of a system 160 that extends system 60 of FIG. 3 to a system that provides N difference measurements using (N+1) sources.
- DSP's digital signal processors
- a DSP can carry out the functions of: waveform generation, waveform mathematics, including mixing and differentiation, digital filtering, as well as servo control of the output waveforms that drive the sources or their amplitude modulators.
- a digital signal processor or a microprocessor can also perform the computationally intensive operations of data analysis, including the chemometric algorithms necessary to convert the raw spectral data to concentration measurements.
- FIG. 9 is a schematic of a system 170 using a DSP 172 for these functions. This is a variant of the system shown in FIG. 8.
- Two analog-to-digital converters (ADC's) 175 and 177 respectively transform the signals from preamplifiers 40 and 71 to digital signals used to provide data to DSP 172.
- the DSP also controls the modulation amplitudes of the sources by means of an array of digital-to-analog converters 178.
- FIG. 10 shows an alternative tunable two-wavelength source assembly for providing a plurality of difference measurements with two sources.
- the tunable filter depicted in the figure is a graded circular interference filter 190 which is currently commercially available from Optical Coating Laboratories, Inc. (OCLI).
- Filter 190 is rotationally driven by a stepper motor 192 that is used to scan the spectrophotometer through the spectral range determined by the filter and the output range of the light sources.
- Typical graded interference filters might span the ranges of 400-1000 nm and 1000-2000 nm.
- a linearly graded filter may also be used, with a stepper motor that provides translational rather than rotational increments.
- N+1 or 2N sources may be arranged around the filter with each source emitting light through a different region of the filter and hence at a different wavelength.
- An alternative embodiment uses a pair of beams from a broadband source (visible or infrared) to illuminate two closely spaced portions of the graded filter to provide two closely spaced wavelengths.
- a beam chopper is used to modulate the two beams out of phase (one beam is illuminating its portion of the filter while the other beam is blocked).
- An optical encoder on the chopper is used to generate the reference electrical signal for phase-sensitive detection. As the stepper motor moves the graded filter, the beams illuminate different portions of the filter. By suitable selection of beam spacing and stepper motor increments, one can achieve measurements for desired wavelength separations over desired spectral regions.
- Another alternative embodiment for the tunable light source uses a monochrometer with a diffraction grating.
- a pair of parallel input slits can be used to select and to superimpose the light at the two wavelengths upon a single output slit.
- the light sources can be independently amplitude modulated either internally or externally.
- the output power of an LED or a laser diode can be modulated by modulating its drive current.
- the power from one or more sources can be modulated externally by means of an optical modulators, such as, for example, an electro-optic modulator, acousto-optic modulator, or liquid-crystal modulator.
- An alternative mechanism of source modulation involves the modulation of the optical wavelength (or frequency) of a single source.
- the center wavelength of the pass band of an interference filter can be altered by dithering the tilt angle of the filter slightly with respect to direction of beam propagation.
- Additional wavelength tuning methods include a birefringent filter and the use of a grating monochrometer as a narrow band-pass filter. In the latter case, dithering the angle of the diffraction grating by a small amount varies the center wavelength of its output beam. These methods yield phase-sensitive detection in a straightforward manner. Null-point detection is best achieved by modulating the source intensity in phase or out of phase with the wavelength dither.
- the beam homogenizer depicted in FIGS. 1 and 3-9 is a tapered fiber-optic bundle optically coupled to a large single-core multimode fiber.
- Alternative beam homogenizers include integrating spheres and scattering media, such as ground glass substrates positioned between the source assembly and the sample. Certain applications for which the signals are strong compared with competing variations, such as measurement of oxygen saturation of hemoglobin as applied in pulse oximetry, may not require beam homogenization.
- the mixer can be of the radio-frequency type, an analog multiplier, or its functions can be performed digitally by a DSP for embodiments using a DSP.
- This invention may also be extended to very high spectral resolution through the use of high-resolution sources, such as lasers.
- high-resolution sources such as lasers.
- two very nearly monochromatic lasers emitting wavelengths ⁇ and ⁇ + ⁇ , where ⁇ is very small (not necessarily greater than the respective source bandwidths) can be used as the sources.
- care must be taken so that the frequency of the amplitude modulation, ⁇ , is less than c/ ⁇ so that additional sidebands are not created that will be detrimental to the spectral resolution of the device. All other aspects of this invention apply in this case without modification.
- the present invention provides a powerful and inexpensive diagnostic tool for deriving spectral information at low noise and drift levels.
- a system according to the invention has the sensitivity of research-grade spectrophotometers at a small fraction the cost.
Abstract
Description
P.sub.tot =P.sub.1 +P.sub.2+ (ΔP.sub.2 -ΔP.sub.1) cos(Ωt)
Claims (11)
Priority Applications (1)
| Application Number | Priority Date | Filing Date | Title |
|---|---|---|---|
| US08/518,427 US5774213A (en) | 1995-04-21 | 1995-08-23 | Techniques for measuring difference of an optical property at two wavelengths by modulating two sources to have opposite-phase components at a common frequency |
Applications Claiming Priority (2)
| Application Number | Priority Date | Filing Date | Title |
|---|---|---|---|
| US42679095A | 1995-04-21 | 1995-04-21 | |
| US08/518,427 US5774213A (en) | 1995-04-21 | 1995-08-23 | Techniques for measuring difference of an optical property at two wavelengths by modulating two sources to have opposite-phase components at a common frequency |
Related Parent Applications (1)
| Application Number | Title | Priority Date | Filing Date |
|---|---|---|---|
| US42679095A Continuation-In-Part | 1995-04-21 | 1995-04-21 |
Publications (1)
| Publication Number | Publication Date |
|---|---|
| US5774213A true US5774213A (en) | 1998-06-30 |
Family
ID=23692215
Family Applications (1)
| Application Number | Title | Priority Date | Filing Date |
|---|---|---|---|
| US08/518,427 Expired - Fee Related US5774213A (en) | 1995-04-21 | 1995-08-23 | Techniques for measuring difference of an optical property at two wavelengths by modulating two sources to have opposite-phase components at a common frequency |
Country Status (1)
| Country | Link |
|---|---|
| US (1) | US5774213A (en) |
Cited By (132)
| Publication number | Priority date | Publication date | Assignee | Title |
|---|---|---|---|---|
| US5995858A (en) * | 1997-11-07 | 1999-11-30 | Datascope Investment Corp. | Pulse oximeter |
| US6144444A (en) * | 1998-11-06 | 2000-11-07 | Medtronic Avecor Cardiovascular, Inc. | Apparatus and method to determine blood parameters |
| US6304324B1 (en) * | 1998-05-25 | 2001-10-16 | Ando Electric Co., Ltd. | Method of calculating optical frequency spectrum |
| US6377840B1 (en) * | 1999-06-03 | 2002-04-23 | Hutchinson Technology Incorporated | Signal acquisition and processing system for reduced output signal drift in a spectrophotometric instrument |
| US6397092B1 (en) | 1999-12-17 | 2002-05-28 | Datex-Ohmeda, Inc. | Oversampling pulse oximeter |
| WO2002082990A1 (en) * | 2001-04-11 | 2002-10-24 | Rio Grande Medical Technologies, Inc. | System for non-invasive measurement of glucose in humans |
| US6505133B1 (en) | 2000-11-15 | 2003-01-07 | Datex-Ohmeda, Inc. | Simultaneous signal attenuation measurements utilizing code division multiplexing |
| US6504607B2 (en) * | 1999-07-12 | 2003-01-07 | Caliper Technologies, Corp. | Light source power modulation for use with chemical and biochemical analysis |
| US20030099264A1 (en) * | 2001-01-30 | 2003-05-29 | Marcos Dantus | Laser system using ultrashort laser pulses |
| US6603547B2 (en) * | 2000-10-11 | 2003-08-05 | Schott Glas | Method for determination of the radiation stability of crystals |
| US6618615B1 (en) * | 1999-07-23 | 2003-09-09 | Kurabo Industries Ltd. | Apparatus for and method of measuring body fat |
| WO2003012486A3 (en) * | 2001-08-02 | 2003-10-23 | Jonathan Gerlitz | Non-invasive glucose-meter |
| US6667803B1 (en) * | 1999-06-03 | 2003-12-23 | Hutchinson Technology, Inc. | Calibration mode recognition and calibration algorithm for spectrophotometric instrument |
| US20040233944A1 (en) * | 2001-01-30 | 2004-11-25 | Marcos Dantus | Laser system using ultra-short laser pulses |
| US20050012925A1 (en) * | 2003-05-09 | 2005-01-20 | Saptari Vidi A. | Spectroscopic systems and methods |
| US20050021243A1 (en) * | 2001-01-30 | 2005-01-27 | Marcos Dantus | Laser and environmental monitoring system |
| US20050187451A1 (en) * | 2004-02-25 | 2005-08-25 | Norris Mark A. | Simultaneous signal attenuation measurements utilizing frequency orthogonal random codes |
| US20050232317A1 (en) * | 2001-01-30 | 2005-10-20 | Marcos Dantus | Control system and apparatus for use with laser excitation and ionization |
| US20060056468A1 (en) * | 2001-01-30 | 2006-03-16 | Marcos Dantus | Control system and apparatus for use with ultra-fast laser |
| US7047054B2 (en) * | 1999-03-12 | 2006-05-16 | Cas Medical Systems, Inc. | Laser diode optical transducer assembly for non-invasive spectrophotometric blood oxygenation monitoring |
| US20060187974A1 (en) * | 2001-01-30 | 2006-08-24 | Marcos Dantus | Control system and apparatus for use with ultra-fast laser |
| US20060243931A1 (en) * | 2005-04-28 | 2006-11-02 | Honeywell International Inc. | Sensor and methods for measuring select components in moving sheet products |
| US20070058170A1 (en) * | 2005-09-12 | 2007-03-15 | Lodder Robert A | Method and system for in situ spectroscopic evaluation of an object |
| US20070144388A1 (en) * | 2005-12-16 | 2007-06-28 | Honeywell International Inc. | Apparatus, system, and method for print quality measurements |
| EP1897486A1 (en) * | 2006-09-11 | 2008-03-12 | FOSS Analytical AB | Optical blood analyte monitor |
| GB2442101A (en) * | 2006-09-08 | 2008-03-26 | Crowcon Detection Instr Ltd | A gas detector employing two optical radiation sources and a single detector |
| US20080170218A1 (en) * | 2005-02-14 | 2008-07-17 | Board Of Trustees Of Michigan State University | Ultra-Fast Laser System |
| US20080297764A1 (en) * | 2006-11-13 | 2008-12-04 | Weinmann Gerate Fur Medizin Gmbh + Co. Kg | Sensor for determining body parameters |
| US20090184257A1 (en) * | 2008-01-22 | 2009-07-23 | Honeywell International Inc. | Apparatus and method for measuring and/or controlling ultraviolet-activated materials in a paper-making process |
| US20090185185A1 (en) * | 2008-01-22 | 2009-07-23 | Honeywell International Inc. | Apparatus and method for camera-based color measurements |
| US20090188901A1 (en) * | 2006-04-10 | 2009-07-30 | Board Of Trustees Of Michigan State University | Laser Material Processing System |
| US7573575B2 (en) | 2005-12-29 | 2009-08-11 | Honeywell International Inc. | System and method for color measurements or other spectral measurements of a material |
| US20090204366A1 (en) * | 2008-02-11 | 2009-08-13 | Jonathan Gerlitz | Apparatus and method for non-invasive measurement of the concentration of a substance in subject's blood |
| US20090238222A1 (en) * | 2001-01-30 | 2009-09-24 | Board Of Trustees Of Michigan State University | Laser system employing harmonic generation |
| US7647084B2 (en) | 2005-08-08 | 2010-01-12 | Nellcor Puritan Bennett Llc | Medical sensor and technique for using the same |
| US7650177B2 (en) | 2005-09-29 | 2010-01-19 | Nellcor Puritan Bennett Llc | Medical sensor for reducing motion artifacts and technique for using the same |
| US7657296B2 (en) | 2005-08-08 | 2010-02-02 | Nellcor Puritan Bennett Llc | Unitary medical sensor assembly and technique for using the same |
| US7657295B2 (en) | 2005-08-08 | 2010-02-02 | Nellcor Puritan Bennett Llc | Medical sensor and technique for using the same |
| US7658652B2 (en) | 2006-09-29 | 2010-02-09 | Nellcor Puritan Bennett Llc | Device and method for reducing crosstalk |
| US7676253B2 (en) | 2005-09-29 | 2010-03-09 | Nellcor Puritan Bennett Llc | Medical sensor and technique for using the same |
| US7680522B2 (en) | 2006-09-29 | 2010-03-16 | Nellcor Puritan Bennett Llc | Method and apparatus for detecting misapplied sensors |
| US7684842B2 (en) | 2006-09-29 | 2010-03-23 | Nellcor Puritan Bennett Llc | System and method for preventing sensor misuse |
| US7689259B2 (en) | 2000-04-17 | 2010-03-30 | Nellcor Puritan Bennett Llc | Pulse oximeter sensor with piece-wise function |
| US7688447B2 (en) | 2005-12-29 | 2010-03-30 | Honeywell International Inc. | Color sensor |
| US20100187208A1 (en) * | 2009-01-23 | 2010-07-29 | Board Of Trustees Of Michigan State University | Laser pulse synthesis system |
| US7796403B2 (en) | 2006-09-28 | 2010-09-14 | Nellcor Puritan Bennett Llc | Means for mechanical registration and mechanical-electrical coupling of a faraday shield to a photodetector and an electrical circuit |
| US7859668B2 (en) | 2005-12-15 | 2010-12-28 | Honeywell International Inc. | Apparatus and method for illuminator-independent color measurements |
| US7869849B2 (en) | 2006-09-26 | 2011-01-11 | Nellcor Puritan Bennett Llc | Opaque, electrically nonconductive region on a medical sensor |
| US7880884B2 (en) | 2008-06-30 | 2011-02-01 | Nellcor Puritan Bennett Llc | System and method for coating and shielding electronic sensor components |
| US7881762B2 (en) | 2005-09-30 | 2011-02-01 | Nellcor Puritan Bennett Llc | Clip-style medical sensor and technique for using the same |
| US7890153B2 (en) | 2006-09-28 | 2011-02-15 | Nellcor Puritan Bennett Llc | System and method for mitigating interference in pulse oximetry |
| US7887345B2 (en) | 2008-06-30 | 2011-02-15 | Nellcor Puritan Bennett Llc | Single use connector for pulse oximetry sensors |
| US7894869B2 (en) | 2007-03-09 | 2011-02-22 | Nellcor Puritan Bennett Llc | Multiple configuration medical sensor and technique for using the same |
| US7899510B2 (en) | 2005-09-29 | 2011-03-01 | Nellcor Puritan Bennett Llc | Medical sensor and technique for using the same |
| US20110211600A1 (en) * | 2010-03-01 | 2011-09-01 | Board Of Trustees Of Michigan State University | Laser system for output manipulation |
| US8062221B2 (en) | 2005-09-30 | 2011-11-22 | Nellcor Puritan Bennett Llc | Sensor for tissue gas detection and technique for using the same |
| US8068891B2 (en) | 2006-09-29 | 2011-11-29 | Nellcor Puritan Bennett Llc | Symmetric LED array for pulse oximetry |
| US8073518B2 (en) | 2006-05-02 | 2011-12-06 | Nellcor Puritan Bennett Llc | Clip-style medical sensor and technique for using the same |
| US8070508B2 (en) | 2007-12-31 | 2011-12-06 | Nellcor Puritan Bennett Llc | Method and apparatus for aligning and securing a cable strain relief |
| US8071935B2 (en) | 2008-06-30 | 2011-12-06 | Nellcor Puritan Bennett Llc | Optical detector with an overmolded faraday shield |
| US8092379B2 (en) | 2005-09-29 | 2012-01-10 | Nellcor Puritan Bennett Llc | Method and system for determining when to reposition a physiological sensor |
| US8092993B2 (en) | 2007-12-31 | 2012-01-10 | Nellcor Puritan Bennett Llc | Hydrogel thin film for use as a biosensor |
| JP2012007890A (en) * | 2010-06-22 | 2012-01-12 | Seiko Epson Corp | Spectrometer |
| US8112375B2 (en) | 2008-03-31 | 2012-02-07 | Nellcor Puritan Bennett Llc | Wavelength selection and outlier detection in reduced rank linear models |
| US8133176B2 (en) | 1999-04-14 | 2012-03-13 | Tyco Healthcare Group Lp | Method and circuit for indicating quality and accuracy of physiological measurements |
| US8145288B2 (en) | 2006-08-22 | 2012-03-27 | Nellcor Puritan Bennett Llc | Medical sensor for reducing signal artifacts and technique for using the same |
| US8175667B2 (en) | 2006-09-29 | 2012-05-08 | Nellcor Puritan Bennett Llc | Symmetric LED array for pulse oximetry |
| US8175671B2 (en) | 2006-09-22 | 2012-05-08 | Nellcor Puritan Bennett Llc | Medical sensor for reducing signal artifacts and technique for using the same |
| US8190224B2 (en) | 2006-09-22 | 2012-05-29 | Nellcor Puritan Bennett Llc | Medical sensor for reducing signal artifacts and technique for using the same |
| US8199007B2 (en) | 2007-12-31 | 2012-06-12 | Nellcor Puritan Bennett Llc | Flex circuit snap track for a biometric sensor |
| US8219170B2 (en) | 2006-09-20 | 2012-07-10 | Nellcor Puritan Bennett Llc | System and method for practicing spectrophotometry using light emitting nanostructure devices |
| US8219169B2 (en) | 2008-02-11 | 2012-07-10 | Glucovista Inc. | Apparatus and method using light retro-reflected from a retina to non-invasively measure the blood concentration of a substance |
| US8221319B2 (en) | 2009-03-25 | 2012-07-17 | Nellcor Puritan Bennett Llc | Medical device for assessing intravascular blood volume and technique for using the same |
| US8224412B2 (en) | 2000-04-17 | 2012-07-17 | Nellcor Puritan Bennett Llc | Pulse oximeter sensor with piece-wise function |
| US8233954B2 (en) | 2005-09-30 | 2012-07-31 | Nellcor Puritan Bennett Llc | Mucosal sensor for the assessment of tissue and blood constituents and technique for using the same |
| US8260391B2 (en) | 2005-09-12 | 2012-09-04 | Nellcor Puritan Bennett Llc | Medical sensor for reducing motion artifacts and technique for using the same |
| US8265724B2 (en) | 2007-03-09 | 2012-09-11 | Nellcor Puritan Bennett Llc | Cancellation of light shunting |
| US8280469B2 (en) | 2007-03-09 | 2012-10-02 | Nellcor Puritan Bennett Llc | Method for detection of aberrant tissue spectra |
| US8311069B2 (en) | 2007-12-21 | 2012-11-13 | Board Of Trustees Of Michigan State University | Direct ultrashort laser system |
| US8311601B2 (en) | 2009-06-30 | 2012-11-13 | Nellcor Puritan Bennett Llc | Reflectance and/or transmissive pulse oximeter |
| US8315685B2 (en) | 2006-09-27 | 2012-11-20 | Nellcor Puritan Bennett Llc | Flexible medical sensor enclosure |
| US8346328B2 (en) | 2007-12-21 | 2013-01-01 | Covidien Lp | Medical sensor and technique for using the same |
| US8352004B2 (en) | 2007-12-21 | 2013-01-08 | Covidien Lp | Medical sensor and technique for using the same |
| US8352009B2 (en) | 2005-09-30 | 2013-01-08 | Covidien Lp | Medical sensor and technique for using the same |
| US8352010B2 (en) | 2005-09-30 | 2013-01-08 | Covidien Lp | Folding medical sensor and technique for using the same |
| US8364220B2 (en) | 2008-09-25 | 2013-01-29 | Covidien Lp | Medical sensor and technique for using the same |
| US8366613B2 (en) | 2007-12-26 | 2013-02-05 | Covidien Lp | LED drive circuit for pulse oximetry and method for using same |
| US8386002B2 (en) | 2005-09-30 | 2013-02-26 | Covidien Lp | Optically aligned pulse oximetry sensor and technique for using the same |
| US8391941B2 (en) | 2009-07-17 | 2013-03-05 | Covidien Lp | System and method for memory switching for multiple configuration medical sensor |
| US8396527B2 (en) | 2006-09-22 | 2013-03-12 | Covidien Lp | Medical sensor for reducing signal artifacts and technique for using the same |
| US8401809B2 (en) | 2010-07-12 | 2013-03-19 | Honeywell International Inc. | System and method for adjusting an on-line appearance sensor system |
| US8417310B2 (en) | 2009-08-10 | 2013-04-09 | Covidien Lp | Digital switching in multi-site sensor |
| US8417309B2 (en) | 2008-09-30 | 2013-04-09 | Covidien Lp | Medical sensor |
| US8423112B2 (en) | 2008-09-30 | 2013-04-16 | Covidien Lp | Medical sensor and technique for using the same |
| US8428675B2 (en) | 2009-08-19 | 2013-04-23 | Covidien Lp | Nanofiber adhesives used in medical devices |
| US8433383B2 (en) | 2001-10-12 | 2013-04-30 | Covidien Lp | Stacked adhesive optical sensor |
| US8437822B2 (en) | 2008-03-28 | 2013-05-07 | Covidien Lp | System and method for estimating blood analyte concentration |
| US8442608B2 (en) | 2007-12-28 | 2013-05-14 | Covidien Lp | System and method for estimating physiological parameters by deconvolving artifacts |
| US8452364B2 (en) | 2007-12-28 | 2013-05-28 | Covidien LLP | System and method for attaching a sensor to a patient's skin |
| US8452366B2 (en) | 2009-03-16 | 2013-05-28 | Covidien Lp | Medical monitoring device with flexible circuitry |
| US8483790B2 (en) | 2002-10-18 | 2013-07-09 | Covidien Lp | Non-adhesive oximeter sensor for sensitive skin |
| US8509869B2 (en) | 2009-05-15 | 2013-08-13 | Covidien Lp | Method and apparatus for detecting and analyzing variations in a physiologic parameter |
| US8505821B2 (en) | 2009-06-30 | 2013-08-13 | Covidien Lp | System and method for providing sensor quality assurance |
| WO2013148666A1 (en) * | 2012-03-27 | 2013-10-03 | Innovative Science Tools, Inc. | Optical analyzer for identification of materials using reflectance spectroscopy |
| US8577434B2 (en) | 2007-12-27 | 2013-11-05 | Covidien Lp | Coaxial LED light sources |
| US8618470B2 (en) | 2005-11-30 | 2013-12-31 | Board Of Trustees Of Michigan State University | Laser based identification of molecular characteristics |
| EP2679982A1 (en) * | 2012-06-28 | 2014-01-01 | ELMOS Semiconductor AG | Method and sensor system for measuring the transmission properties of a transmission path of a measuring system between transmitter and recipient |
| US8634891B2 (en) | 2009-05-20 | 2014-01-21 | Covidien Lp | Method and system for self regulation of sensor component contact pressure |
| US8649838B2 (en) | 2010-09-22 | 2014-02-11 | Covidien Lp | Wavelength switching for pulse oximetry |
| US8649839B2 (en) | 1996-10-10 | 2014-02-11 | Covidien Lp | Motion compatible sensor for non-invasive optical blood analysis |
| DE102013000376A1 (en) | 2013-01-07 | 2014-07-10 | Elmos Semiconductor Ag | Apparatus for optical measurement of biometric parameters of vertebrate animal or human, has controller that outputs internal control signal as intermediate signal, whose course is evaluated to extract biometric parameter |
| US8778022B2 (en) | 2004-11-02 | 2014-07-15 | E-Vision Smart Optics Inc. | Electro-active intraocular lenses |
| DE102013019660A1 (en) | 2013-02-12 | 2014-08-14 | Elmos Semiconductor Ag | Sensor system for optical measurement of biometric parameters of animal or plant or human, has first transmitter, second transmitter and receiver, where first transmitter is operated with first feed signal of signal generator |
| US8861075B2 (en) | 2009-03-05 | 2014-10-14 | Board Of Trustees Of Michigan State University | Laser amplification system |
| US8897850B2 (en) | 2007-12-31 | 2014-11-25 | Covidien Lp | Sensor with integrated living hinge and spring |
| US8914088B2 (en) | 2008-09-30 | 2014-12-16 | Covidien Lp | Medical sensor and technique for using the same |
| US20150022817A1 (en) * | 2013-07-19 | 2015-01-22 | Quality Vision International, Inc. | Profilometer with partial coherence interferometer adapted for avoiding... |
| US9010634B2 (en) | 2009-06-30 | 2015-04-21 | Covidien Lp | System and method for linking patient data to a patient and providing sensor quality assurance |
| US20150185152A1 (en) * | 2012-08-09 | 2015-07-02 | Life Technologies Corporation | Illumination Systems |
| CN105606565A (en) * | 2016-02-25 | 2016-05-25 | 中国科学院合肥物质科学研究院 | Wavelength modulation absorption spectrum measurement device |
| US20160334285A1 (en) * | 2014-01-24 | 2016-11-17 | Tubitak (Turkiye Bilimsel Ve Teknolojik Arastirma Kurumu) | FIBER COUPLED INTEGRATING SPHERE BASED-LASER ENERGY METER AND CALIBRATION SYSTEM (FCIS based - LEMCS) TRACEABLE TO PRIMARY LEVEL STANDARDS |
| US9801709B2 (en) | 2004-11-02 | 2017-10-31 | E-Vision Smart Optics, Inc. | Electro-active intraocular lenses |
| US9861305B1 (en) | 2006-10-12 | 2018-01-09 | Masimo Corporation | Method and apparatus for calibration to reduce coupling between signals in a measurement system |
| CN107923841A (en) * | 2015-08-18 | 2018-04-17 | 国立大学法人德岛大学 | Concentration measurement apparatus |
| WO2018148701A1 (en) * | 2017-02-13 | 2018-08-16 | Massachusetts Institute Of Technology | Methods and system for multi-channel bio-optical sensing |
| US20190041722A1 (en) * | 2017-08-01 | 2019-02-07 | Zoetis Services Llc | Apparatus for analyzing a media, and associated egg identification apparatus and method |
| US10441176B2 (en) | 2012-12-31 | 2019-10-15 | Omni Medsci, Inc. | Imaging using near-infrared laser diodes with distributed bragg reflectors |
| US10517484B2 (en) | 2012-12-31 | 2019-12-31 | Omni Medsci, Inc. | Semiconductor diodes-based physiological measurement device with improved signal-to-noise ratio |
| US10660526B2 (en) | 2012-12-31 | 2020-05-26 | Omni Medsci, Inc. | Near-infrared time-of-flight imaging using laser diodes with Bragg reflectors |
| US10677774B2 (en) | 2012-12-31 | 2020-06-09 | Omni Medsci, Inc. | Near-infrared time-of-flight cameras and imaging |
| US10874304B2 (en) | 2012-12-31 | 2020-12-29 | Omni Medsci, Inc. | Semiconductor source based near infrared measurement device with improved signal-to-noise ratio |
| US10920242B2 (en) | 2011-02-25 | 2021-02-16 | Recombinetics, Inc. | Non-meiotic allele introgression |
Citations (18)
| Publication number | Priority date | Publication date | Assignee | Title |
|---|---|---|---|---|
| US2601182A (en) * | 1949-04-23 | 1952-06-17 | Interchem Corp | Photometric apparatus |
| US3332313A (en) * | 1962-04-02 | 1967-07-25 | Du Pont | Apparatus for absorption spectra analysis |
| US3472594A (en) * | 1966-06-06 | 1969-10-14 | Philips Corp | Multi-channel atomic absorption spectrometer |
| US3647299A (en) * | 1970-04-20 | 1972-03-07 | American Optical Corp | Oximeter |
| US3799672A (en) * | 1972-09-15 | 1974-03-26 | Us Health Education & Welfare | Oximeter for monitoring oxygen saturation in blood |
| US4183669A (en) * | 1977-09-06 | 1980-01-15 | Laser Precision Corporartion | Dual beam Fourier spectrometer |
| US4305659A (en) * | 1980-03-06 | 1981-12-15 | Baxter Travenol Laboratories, Inc. | Photometric apparatus and method |
| US4350441A (en) * | 1980-06-30 | 1982-09-21 | Baxter Travenol Laboratories, Inc. | Photometric apparatus and method |
| US4529308A (en) * | 1982-05-28 | 1985-07-16 | Hunter Associates Laboratory, Inc. | Spectrophotometer apparatus and method including scale drift correction feature |
| US4948248A (en) * | 1988-07-22 | 1990-08-14 | Invivo Research Inc. | Blood constituent measuring device and method |
| US5028787A (en) * | 1989-01-19 | 1991-07-02 | Futrex, Inc. | Non-invasive measurement of blood glucose |
| US5059027A (en) * | 1989-04-11 | 1991-10-22 | Wisconsin Alumni Research Foundation | Spatial heterodyne spectrometer and method |
| US5137023A (en) * | 1990-04-19 | 1992-08-11 | Worcester Polytechnic Institute | Method and apparatus for monitoring blood analytes noninvasively by pulsatile photoplethysmography |
| US5184193A (en) * | 1989-01-04 | 1993-02-02 | Guided Wave | Dual fiber optic spectrophotometer |
| US5206701A (en) * | 1991-09-20 | 1993-04-27 | Amoco Corporation | Apparatus for near-infrared spectrophotometric analysis |
| US5245406A (en) * | 1991-01-11 | 1993-09-14 | Jeol Ltd. | Fourier transform spectroscopy and spectrometer |
| US5251008A (en) * | 1991-01-11 | 1993-10-05 | Jeol Ltd. | Fourier transform spectroscopy and spectrometer |
| US5349952A (en) * | 1991-03-05 | 1994-09-27 | Sensormedics Corp. | Photoplethysmographics using phase-division multiplexing |
-
1995
- 1995-08-23 US US08/518,427 patent/US5774213A/en not_active Expired - Fee Related
Patent Citations (18)
| Publication number | Priority date | Publication date | Assignee | Title |
|---|---|---|---|---|
| US2601182A (en) * | 1949-04-23 | 1952-06-17 | Interchem Corp | Photometric apparatus |
| US3332313A (en) * | 1962-04-02 | 1967-07-25 | Du Pont | Apparatus for absorption spectra analysis |
| US3472594A (en) * | 1966-06-06 | 1969-10-14 | Philips Corp | Multi-channel atomic absorption spectrometer |
| US3647299A (en) * | 1970-04-20 | 1972-03-07 | American Optical Corp | Oximeter |
| US3799672A (en) * | 1972-09-15 | 1974-03-26 | Us Health Education & Welfare | Oximeter for monitoring oxygen saturation in blood |
| US4183669A (en) * | 1977-09-06 | 1980-01-15 | Laser Precision Corporartion | Dual beam Fourier spectrometer |
| US4305659A (en) * | 1980-03-06 | 1981-12-15 | Baxter Travenol Laboratories, Inc. | Photometric apparatus and method |
| US4350441A (en) * | 1980-06-30 | 1982-09-21 | Baxter Travenol Laboratories, Inc. | Photometric apparatus and method |
| US4529308A (en) * | 1982-05-28 | 1985-07-16 | Hunter Associates Laboratory, Inc. | Spectrophotometer apparatus and method including scale drift correction feature |
| US4948248A (en) * | 1988-07-22 | 1990-08-14 | Invivo Research Inc. | Blood constituent measuring device and method |
| US5184193A (en) * | 1989-01-04 | 1993-02-02 | Guided Wave | Dual fiber optic spectrophotometer |
| US5028787A (en) * | 1989-01-19 | 1991-07-02 | Futrex, Inc. | Non-invasive measurement of blood glucose |
| US5059027A (en) * | 1989-04-11 | 1991-10-22 | Wisconsin Alumni Research Foundation | Spatial heterodyne spectrometer and method |
| US5137023A (en) * | 1990-04-19 | 1992-08-11 | Worcester Polytechnic Institute | Method and apparatus for monitoring blood analytes noninvasively by pulsatile photoplethysmography |
| US5245406A (en) * | 1991-01-11 | 1993-09-14 | Jeol Ltd. | Fourier transform spectroscopy and spectrometer |
| US5251008A (en) * | 1991-01-11 | 1993-10-05 | Jeol Ltd. | Fourier transform spectroscopy and spectrometer |
| US5349952A (en) * | 1991-03-05 | 1994-09-27 | Sensormedics Corp. | Photoplethysmographics using phase-division multiplexing |
| US5206701A (en) * | 1991-09-20 | 1993-04-27 | Amoco Corporation | Apparatus for near-infrared spectrophotometric analysis |
Non-Patent Citations (2)
| Title |
|---|
| Kelleher, Joseph F., "Pulse Oximetry," Little, Brown and Co., 1989, pp. 37-62. |
| Kelleher, Joseph F., Pulse Oximetry, Little, Brown and Co., 1989, pp. 37 62. * |
Cited By (206)
| Publication number | Priority date | Publication date | Assignee | Title |
|---|---|---|---|---|
| US8649839B2 (en) | 1996-10-10 | 2014-02-11 | Covidien Lp | Motion compatible sensor for non-invasive optical blood analysis |
| US5995858A (en) * | 1997-11-07 | 1999-11-30 | Datascope Investment Corp. | Pulse oximeter |
| US6304324B1 (en) * | 1998-05-25 | 2001-10-16 | Ando Electric Co., Ltd. | Method of calculating optical frequency spectrum |
| US6144444A (en) * | 1998-11-06 | 2000-11-07 | Medtronic Avecor Cardiovascular, Inc. | Apparatus and method to determine blood parameters |
| US7047054B2 (en) * | 1999-03-12 | 2006-05-16 | Cas Medical Systems, Inc. | Laser diode optical transducer assembly for non-invasive spectrophotometric blood oxygenation monitoring |
| US8133176B2 (en) | 1999-04-14 | 2012-03-13 | Tyco Healthcare Group Lp | Method and circuit for indicating quality and accuracy of physiological measurements |
| US6377840B1 (en) * | 1999-06-03 | 2002-04-23 | Hutchinson Technology Incorporated | Signal acquisition and processing system for reduced output signal drift in a spectrophotometric instrument |
| US6667803B1 (en) * | 1999-06-03 | 2003-12-23 | Hutchinson Technology, Inc. | Calibration mode recognition and calibration algorithm for spectrophotometric instrument |
| US6504607B2 (en) * | 1999-07-12 | 2003-01-07 | Caliper Technologies, Corp. | Light source power modulation for use with chemical and biochemical analysis |
| US6618615B1 (en) * | 1999-07-23 | 2003-09-09 | Kurabo Industries Ltd. | Apparatus for and method of measuring body fat |
| US6397092B1 (en) | 1999-12-17 | 2002-05-28 | Datex-Ohmeda, Inc. | Oversampling pulse oximeter |
| US6748253B2 (en) | 1999-12-17 | 2004-06-08 | Datex-Ohmeda, Inc. | Oversampling pulse oximeter |
| US8078246B2 (en) | 2000-04-17 | 2011-12-13 | Nellcor Puritan Bennett Llc | Pulse oximeter sensor with piece-wise function |
| US7689259B2 (en) | 2000-04-17 | 2010-03-30 | Nellcor Puritan Bennett Llc | Pulse oximeter sensor with piece-wise function |
| US8224412B2 (en) | 2000-04-17 | 2012-07-17 | Nellcor Puritan Bennett Llc | Pulse oximeter sensor with piece-wise function |
| US6603547B2 (en) * | 2000-10-11 | 2003-08-05 | Schott Glas | Method for determination of the radiation stability of crystals |
| US20030028357A1 (en) * | 2000-11-15 | 2003-02-06 | Norris Mark A. | Reduced cross talk pulse oximeter |
| US6505133B1 (en) | 2000-11-15 | 2003-01-07 | Datex-Ohmeda, Inc. | Simultaneous signal attenuation measurements utilizing code division multiplexing |
| US6778923B2 (en) | 2000-11-15 | 2004-08-17 | DatexθOhmeda, Inc. | Reduced cross talk pulse oximeter |
| US8208504B2 (en) | 2001-01-30 | 2012-06-26 | Board Of Trustees Operation Michigan State University | Laser pulse shaping system |
| US20040233944A1 (en) * | 2001-01-30 | 2004-11-25 | Marcos Dantus | Laser system using ultra-short laser pulses |
| US7583710B2 (en) | 2001-01-30 | 2009-09-01 | Board Of Trustees Operating Michigan State University | Laser and environmental monitoring system |
| US20050232317A1 (en) * | 2001-01-30 | 2005-10-20 | Marcos Dantus | Control system and apparatus for use with laser excitation and ionization |
| US20060056468A1 (en) * | 2001-01-30 | 2006-03-16 | Marcos Dantus | Control system and apparatus for use with ultra-fast laser |
| US20090257464A1 (en) * | 2001-01-30 | 2009-10-15 | Board Of Trustees Of Michigan State University | Control system and apparatus for use with ultra-fast laser |
| US20060187974A1 (en) * | 2001-01-30 | 2006-08-24 | Marcos Dantus | Control system and apparatus for use with ultra-fast laser |
| US20030099264A1 (en) * | 2001-01-30 | 2003-05-29 | Marcos Dantus | Laser system using ultrashort laser pulses |
| US7973936B2 (en) | 2001-01-30 | 2011-07-05 | Board Of Trustees Of Michigan State University | Control system and apparatus for use with ultra-fast laser |
| US7567596B2 (en) | 2001-01-30 | 2009-07-28 | Board Of Trustees Of Michigan State University | Control system and apparatus for use with ultra-fast laser |
| US8208505B2 (en) | 2001-01-30 | 2012-06-26 | Board Of Trustees Of Michigan State University | Laser system employing harmonic generation |
| US20050021243A1 (en) * | 2001-01-30 | 2005-01-27 | Marcos Dantus | Laser and environmental monitoring system |
| US20090238222A1 (en) * | 2001-01-30 | 2009-09-24 | Board Of Trustees Of Michigan State University | Laser system employing harmonic generation |
| US20090122819A1 (en) * | 2001-01-30 | 2009-05-14 | Board Of Trustees Operating Michigan State Univers | Laser Pulse Shaping System |
| US7450618B2 (en) | 2001-01-30 | 2008-11-11 | Board Of Trustees Operating Michigan State University | Laser system using ultrashort laser pulses |
| US7439497B2 (en) | 2001-01-30 | 2008-10-21 | Board Of Trustees Of Michigan State University | Control system and apparatus for use with laser excitation and ionization |
| US8300669B2 (en) | 2001-01-30 | 2012-10-30 | Board Of Trustees Of Michigan State University | Control system and apparatus for use with ultra-fast laser |
| US8265110B2 (en) | 2001-01-30 | 2012-09-11 | Board Of Trustees Operating Michigan State University | Laser and environmental monitoring method |
| US7609731B2 (en) | 2001-01-30 | 2009-10-27 | Board Of Trustees Operating Michigan State University | Laser system using ultra-short laser pulses |
| WO2002082990A1 (en) * | 2001-04-11 | 2002-10-24 | Rio Grande Medical Technologies, Inc. | System for non-invasive measurement of glucose in humans |
| US6574490B2 (en) * | 2001-04-11 | 2003-06-03 | Rio Grande Medical Technologies, Inc. | System for non-invasive measurement of glucose in humans |
| US7643859B2 (en) | 2001-08-02 | 2010-01-05 | Glucovista, Llc | Non-invasive glucose meter |
| US20080111971A1 (en) * | 2001-08-02 | 2008-05-15 | Gluco Vista | Non-invasive glucose meter |
| CN1319486C (en) * | 2001-08-02 | 2007-06-06 | 乔纳森·格利茨 | Non-invasive glucose-meter |
| US8364219B2 (en) * | 2001-08-02 | 2013-01-29 | Gluco Vista, Inc. | Non-invasive glucose meter |
| WO2003012486A3 (en) * | 2001-08-02 | 2003-10-23 | Jonathan Gerlitz | Non-invasive glucose-meter |
| US7308293B2 (en) | 2001-08-02 | 2007-12-11 | Glucovista, Llc | Non-invasive glucose meter |
| US20040260159A1 (en) * | 2001-08-02 | 2004-12-23 | Jonathan Gerlitz | Non-invasive glucose-meter |
| US20100152558A1 (en) * | 2001-08-02 | 2010-06-17 | Glucovista, Llc | Non-invasive glucose meter |
| US8433383B2 (en) | 2001-10-12 | 2013-04-30 | Covidien Lp | Stacked adhesive optical sensor |
| US8483790B2 (en) | 2002-10-18 | 2013-07-09 | Covidien Lp | Non-adhesive oximeter sensor for sensitive skin |
| US7099003B2 (en) * | 2003-05-09 | 2006-08-29 | Delta Search Labs, Inc. | Spectroscopic systems and methods |
| US20050012925A1 (en) * | 2003-05-09 | 2005-01-20 | Saptari Vidi A. | Spectroscopic systems and methods |
| US7194292B2 (en) | 2004-02-25 | 2007-03-20 | General Electric Company | Simultaneous signal attenuation measurements utilizing frequency orthogonal random codes |
| US20050187451A1 (en) * | 2004-02-25 | 2005-08-25 | Norris Mark A. | Simultaneous signal attenuation measurements utilizing frequency orthogonal random codes |
| US10729539B2 (en) | 2004-11-02 | 2020-08-04 | E-Vision Smart Optics, Inc. | Electro-chromic ophthalmic devices |
| US8778022B2 (en) | 2004-11-02 | 2014-07-15 | E-Vision Smart Optics Inc. | Electro-active intraocular lenses |
| US9801709B2 (en) | 2004-11-02 | 2017-10-31 | E-Vision Smart Optics, Inc. | Electro-active intraocular lenses |
| US8633437B2 (en) | 2005-02-14 | 2014-01-21 | Board Of Trustees Of Michigan State University | Ultra-fast laser system |
| US20080170218A1 (en) * | 2005-02-14 | 2008-07-17 | Board Of Trustees Of Michigan State University | Ultra-Fast Laser System |
| US7291856B2 (en) | 2005-04-28 | 2007-11-06 | Honeywell International Inc. | Sensor and methods for measuring select components in moving sheet products |
| WO2006118619A1 (en) * | 2005-04-28 | 2006-11-09 | Honeywell International Inc. | Sensor and methods for measuring select components in moving sheet products |
| US20060243931A1 (en) * | 2005-04-28 | 2006-11-02 | Honeywell International Inc. | Sensor and methods for measuring select components in moving sheet products |
| US7684843B2 (en) | 2005-08-08 | 2010-03-23 | Nellcor Puritan Bennett Llc | Medical sensor and technique for using the same |
| US7657294B2 (en) | 2005-08-08 | 2010-02-02 | Nellcor Puritan Bennett Llc | Compliant diaphragm medical sensor and technique for using the same |
| US7647084B2 (en) | 2005-08-08 | 2010-01-12 | Nellcor Puritan Bennett Llc | Medical sensor and technique for using the same |
| US8528185B2 (en) | 2005-08-08 | 2013-09-10 | Covidien Lp | Bi-stable medical sensor and technique for using the same |
| US7657296B2 (en) | 2005-08-08 | 2010-02-02 | Nellcor Puritan Bennett Llc | Unitary medical sensor assembly and technique for using the same |
| US7657295B2 (en) | 2005-08-08 | 2010-02-02 | Nellcor Puritan Bennett Llc | Medical sensor and technique for using the same |
| US7738937B2 (en) | 2005-08-08 | 2010-06-15 | Nellcor Puritan Bennett Llc | Medical sensor and technique for using the same |
| US7693559B2 (en) | 2005-08-08 | 2010-04-06 | Nellcor Puritan Bennett Llc | Medical sensor having a deformable region and technique for using the same |
| US8260391B2 (en) | 2005-09-12 | 2012-09-04 | Nellcor Puritan Bennett Llc | Medical sensor for reducing motion artifacts and technique for using the same |
| US20070058170A1 (en) * | 2005-09-12 | 2007-03-15 | Lodder Robert A | Method and system for in situ spectroscopic evaluation of an object |
| US7557923B2 (en) | 2005-09-12 | 2009-07-07 | University Of Kentucky Research Foundation | Method and system for in situ spectroscopic evaluation of an object |
| US7650177B2 (en) | 2005-09-29 | 2010-01-19 | Nellcor Puritan Bennett Llc | Medical sensor for reducing motion artifacts and technique for using the same |
| US8965473B2 (en) | 2005-09-29 | 2015-02-24 | Covidien Lp | Medical sensor for reducing motion artifacts and technique for using the same |
| US8092379B2 (en) | 2005-09-29 | 2012-01-10 | Nellcor Puritan Bennett Llc | Method and system for determining when to reposition a physiological sensor |
| US8060171B2 (en) | 2005-09-29 | 2011-11-15 | Nellcor Puritan Bennett Llc | Medical sensor for reducing motion artifacts and technique for using the same |
| US7729736B2 (en) | 2005-09-29 | 2010-06-01 | Nellcor Puritan Bennett Llc | Medical sensor and technique for using the same |
| US7869850B2 (en) | 2005-09-29 | 2011-01-11 | Nellcor Puritan Bennett Llc | Medical sensor for reducing motion artifacts and technique for using the same |
| US7904130B2 (en) | 2005-09-29 | 2011-03-08 | Nellcor Puritan Bennett Llc | Medical sensor and technique for using the same |
| US7676253B2 (en) | 2005-09-29 | 2010-03-09 | Nellcor Puritan Bennett Llc | Medical sensor and technique for using the same |
| US7899510B2 (en) | 2005-09-29 | 2011-03-01 | Nellcor Puritan Bennett Llc | Medical sensor and technique for using the same |
| US8600469B2 (en) | 2005-09-29 | 2013-12-03 | Covidien Lp | Medical sensor and technique for using the same |
| US8386002B2 (en) | 2005-09-30 | 2013-02-26 | Covidien Lp | Optically aligned pulse oximetry sensor and technique for using the same |
| US7881762B2 (en) | 2005-09-30 | 2011-02-01 | Nellcor Puritan Bennett Llc | Clip-style medical sensor and technique for using the same |
| US8352009B2 (en) | 2005-09-30 | 2013-01-08 | Covidien Lp | Medical sensor and technique for using the same |
| US8233954B2 (en) | 2005-09-30 | 2012-07-31 | Nellcor Puritan Bennett Llc | Mucosal sensor for the assessment of tissue and blood constituents and technique for using the same |
| US8062221B2 (en) | 2005-09-30 | 2011-11-22 | Nellcor Puritan Bennett Llc | Sensor for tissue gas detection and technique for using the same |
| US8352010B2 (en) | 2005-09-30 | 2013-01-08 | Covidien Lp | Folding medical sensor and technique for using the same |
| US8618470B2 (en) | 2005-11-30 | 2013-12-31 | Board Of Trustees Of Michigan State University | Laser based identification of molecular characteristics |
| US7859668B2 (en) | 2005-12-15 | 2010-12-28 | Honeywell International Inc. | Apparatus and method for illuminator-independent color measurements |
| US20070144388A1 (en) * | 2005-12-16 | 2007-06-28 | Honeywell International Inc. | Apparatus, system, and method for print quality measurements |
| US8017927B2 (en) | 2005-12-16 | 2011-09-13 | Honeywell International Inc. | Apparatus, system, and method for print quality measurements using multiple adjustable sensors |
| US7688447B2 (en) | 2005-12-29 | 2010-03-30 | Honeywell International Inc. | Color sensor |
| US7573575B2 (en) | 2005-12-29 | 2009-08-11 | Honeywell International Inc. | System and method for color measurements or other spectral measurements of a material |
| US9018562B2 (en) | 2006-04-10 | 2015-04-28 | Board Of Trustees Of Michigan State University | Laser material processing system |
| US20090188901A1 (en) * | 2006-04-10 | 2009-07-30 | Board Of Trustees Of Michigan State University | Laser Material Processing System |
| US8073518B2 (en) | 2006-05-02 | 2011-12-06 | Nellcor Puritan Bennett Llc | Clip-style medical sensor and technique for using the same |
| US8437826B2 (en) | 2006-05-02 | 2013-05-07 | Covidien Lp | Clip-style medical sensor and technique for using the same |
| US8577436B2 (en) | 2006-08-22 | 2013-11-05 | Covidien Lp | Medical sensor for reducing signal artifacts and technique for using the same |
| US8145288B2 (en) | 2006-08-22 | 2012-03-27 | Nellcor Puritan Bennett Llc | Medical sensor for reducing signal artifacts and technique for using the same |
| US20100078560A1 (en) * | 2006-09-08 | 2010-04-01 | Paul John Basham | Gas detector |
| GB2442101A (en) * | 2006-09-08 | 2008-03-26 | Crowcon Detection Instr Ltd | A gas detector employing two optical radiation sources and a single detector |
| EP1897486A1 (en) * | 2006-09-11 | 2008-03-12 | FOSS Analytical AB | Optical blood analyte monitor |
| WO2008031756A1 (en) * | 2006-09-11 | 2008-03-20 | Foss Analytical Ab | Optical blood analyte monitor |
| US8219170B2 (en) | 2006-09-20 | 2012-07-10 | Nellcor Puritan Bennett Llc | System and method for practicing spectrophotometry using light emitting nanostructure devices |
| US8175671B2 (en) | 2006-09-22 | 2012-05-08 | Nellcor Puritan Bennett Llc | Medical sensor for reducing signal artifacts and technique for using the same |
| US8190225B2 (en) | 2006-09-22 | 2012-05-29 | Nellcor Puritan Bennett Llc | Medical sensor for reducing signal artifacts and technique for using the same |
| US8195264B2 (en) | 2006-09-22 | 2012-06-05 | Nellcor Puritan Bennett Llc | Medical sensor for reducing signal artifacts and technique for using the same |
| US8190224B2 (en) | 2006-09-22 | 2012-05-29 | Nellcor Puritan Bennett Llc | Medical sensor for reducing signal artifacts and technique for using the same |
| US8396527B2 (en) | 2006-09-22 | 2013-03-12 | Covidien Lp | Medical sensor for reducing signal artifacts and technique for using the same |
| US7869849B2 (en) | 2006-09-26 | 2011-01-11 | Nellcor Puritan Bennett Llc | Opaque, electrically nonconductive region on a medical sensor |
| US8315685B2 (en) | 2006-09-27 | 2012-11-20 | Nellcor Puritan Bennett Llc | Flexible medical sensor enclosure |
| US8660626B2 (en) | 2006-09-28 | 2014-02-25 | Covidien Lp | System and method for mitigating interference in pulse oximetry |
| US7796403B2 (en) | 2006-09-28 | 2010-09-14 | Nellcor Puritan Bennett Llc | Means for mechanical registration and mechanical-electrical coupling of a faraday shield to a photodetector and an electrical circuit |
| US7890153B2 (en) | 2006-09-28 | 2011-02-15 | Nellcor Puritan Bennett Llc | System and method for mitigating interference in pulse oximetry |
| US7680522B2 (en) | 2006-09-29 | 2010-03-16 | Nellcor Puritan Bennett Llc | Method and apparatus for detecting misapplied sensors |
| US7684842B2 (en) | 2006-09-29 | 2010-03-23 | Nellcor Puritan Bennett Llc | System and method for preventing sensor misuse |
| US8175667B2 (en) | 2006-09-29 | 2012-05-08 | Nellcor Puritan Bennett Llc | Symmetric LED array for pulse oximetry |
| US7794266B2 (en) | 2006-09-29 | 2010-09-14 | Nellcor Puritan Bennett Llc | Device and method for reducing crosstalk |
| US7658652B2 (en) | 2006-09-29 | 2010-02-09 | Nellcor Puritan Bennett Llc | Device and method for reducing crosstalk |
| US8068891B2 (en) | 2006-09-29 | 2011-11-29 | Nellcor Puritan Bennett Llc | Symmetric LED array for pulse oximetry |
| US10772542B2 (en) | 2006-10-12 | 2020-09-15 | Masimo Corporation | Method and apparatus for calibration to reduce coupling between signals in a measurement system |
| US9861305B1 (en) | 2006-10-12 | 2018-01-09 | Masimo Corporation | Method and apparatus for calibration to reduce coupling between signals in a measurement system |
| US11672447B2 (en) | 2006-10-12 | 2023-06-13 | Masimo Corporation | Method and apparatus for calibration to reduce coupling between signals in a measurement system |
| US20080297764A1 (en) * | 2006-11-13 | 2008-12-04 | Weinmann Gerate Fur Medizin Gmbh + Co. Kg | Sensor for determining body parameters |
| US7894869B2 (en) | 2007-03-09 | 2011-02-22 | Nellcor Puritan Bennett Llc | Multiple configuration medical sensor and technique for using the same |
| US8280469B2 (en) | 2007-03-09 | 2012-10-02 | Nellcor Puritan Bennett Llc | Method for detection of aberrant tissue spectra |
| US8265724B2 (en) | 2007-03-09 | 2012-09-11 | Nellcor Puritan Bennett Llc | Cancellation of light shunting |
| US8311069B2 (en) | 2007-12-21 | 2012-11-13 | Board Of Trustees Of Michigan State University | Direct ultrashort laser system |
| US8346328B2 (en) | 2007-12-21 | 2013-01-01 | Covidien Lp | Medical sensor and technique for using the same |
| US8352004B2 (en) | 2007-12-21 | 2013-01-08 | Covidien Lp | Medical sensor and technique for using the same |
| US8366613B2 (en) | 2007-12-26 | 2013-02-05 | Covidien Lp | LED drive circuit for pulse oximetry and method for using same |
| US8577434B2 (en) | 2007-12-27 | 2013-11-05 | Covidien Lp | Coaxial LED light sources |
| US8452364B2 (en) | 2007-12-28 | 2013-05-28 | Covidien LLP | System and method for attaching a sensor to a patient's skin |
| US8442608B2 (en) | 2007-12-28 | 2013-05-14 | Covidien Lp | System and method for estimating physiological parameters by deconvolving artifacts |
| US8070508B2 (en) | 2007-12-31 | 2011-12-06 | Nellcor Puritan Bennett Llc | Method and apparatus for aligning and securing a cable strain relief |
| US8199007B2 (en) | 2007-12-31 | 2012-06-12 | Nellcor Puritan Bennett Llc | Flex circuit snap track for a biometric sensor |
| US8897850B2 (en) | 2007-12-31 | 2014-11-25 | Covidien Lp | Sensor with integrated living hinge and spring |
| US8092993B2 (en) | 2007-12-31 | 2012-01-10 | Nellcor Puritan Bennett Llc | Hydrogel thin film for use as a biosensor |
| US7592608B2 (en) | 2008-01-22 | 2009-09-22 | Honeywell International Inc. | Apparatus and method for measuring and/or controlling ultraviolet-activated materials in a paper-making process |
| US8049892B2 (en) | 2008-01-22 | 2011-11-01 | Honeywell International Inc. | Apparatus and method for camera-based color measurements |
| US20090185185A1 (en) * | 2008-01-22 | 2009-07-23 | Honeywell International Inc. | Apparatus and method for camera-based color measurements |
| US20090184257A1 (en) * | 2008-01-22 | 2009-07-23 | Honeywell International Inc. | Apparatus and method for measuring and/or controlling ultraviolet-activated materials in a paper-making process |
| US20090204366A1 (en) * | 2008-02-11 | 2009-08-13 | Jonathan Gerlitz | Apparatus and method for non-invasive measurement of the concentration of a substance in subject's blood |
| US8219169B2 (en) | 2008-02-11 | 2012-07-10 | Glucovista Inc. | Apparatus and method using light retro-reflected from a retina to non-invasively measure the blood concentration of a substance |
| US8364218B2 (en) | 2008-02-11 | 2013-01-29 | Glucovista, Inc. | Apparatus and method for non-invasive measurement of the concentration of a substance in subjects blood |
| US8437822B2 (en) | 2008-03-28 | 2013-05-07 | Covidien Lp | System and method for estimating blood analyte concentration |
| US8112375B2 (en) | 2008-03-31 | 2012-02-07 | Nellcor Puritan Bennett Llc | Wavelength selection and outlier detection in reduced rank linear models |
| US8071935B2 (en) | 2008-06-30 | 2011-12-06 | Nellcor Puritan Bennett Llc | Optical detector with an overmolded faraday shield |
| US7880884B2 (en) | 2008-06-30 | 2011-02-01 | Nellcor Puritan Bennett Llc | System and method for coating and shielding electronic sensor components |
| US7887345B2 (en) | 2008-06-30 | 2011-02-15 | Nellcor Puritan Bennett Llc | Single use connector for pulse oximetry sensors |
| US8364220B2 (en) | 2008-09-25 | 2013-01-29 | Covidien Lp | Medical sensor and technique for using the same |
| US8417309B2 (en) | 2008-09-30 | 2013-04-09 | Covidien Lp | Medical sensor |
| US8423112B2 (en) | 2008-09-30 | 2013-04-16 | Covidien Lp | Medical sensor and technique for using the same |
| US8914088B2 (en) | 2008-09-30 | 2014-12-16 | Covidien Lp | Medical sensor and technique for using the same |
| US20100187208A1 (en) * | 2009-01-23 | 2010-07-29 | Board Of Trustees Of Michigan State University | Laser pulse synthesis system |
| US8675699B2 (en) | 2009-01-23 | 2014-03-18 | Board Of Trustees Of Michigan State University | Laser pulse synthesis system |
| US8861075B2 (en) | 2009-03-05 | 2014-10-14 | Board Of Trustees Of Michigan State University | Laser amplification system |
| US8452366B2 (en) | 2009-03-16 | 2013-05-28 | Covidien Lp | Medical monitoring device with flexible circuitry |
| US8221319B2 (en) | 2009-03-25 | 2012-07-17 | Nellcor Puritan Bennett Llc | Medical device for assessing intravascular blood volume and technique for using the same |
| US8509869B2 (en) | 2009-05-15 | 2013-08-13 | Covidien Lp | Method and apparatus for detecting and analyzing variations in a physiologic parameter |
| US8634891B2 (en) | 2009-05-20 | 2014-01-21 | Covidien Lp | Method and system for self regulation of sensor component contact pressure |
| US8505821B2 (en) | 2009-06-30 | 2013-08-13 | Covidien Lp | System and method for providing sensor quality assurance |
| US9010634B2 (en) | 2009-06-30 | 2015-04-21 | Covidien Lp | System and method for linking patient data to a patient and providing sensor quality assurance |
| US8311601B2 (en) | 2009-06-30 | 2012-11-13 | Nellcor Puritan Bennett Llc | Reflectance and/or transmissive pulse oximeter |
| US8391941B2 (en) | 2009-07-17 | 2013-03-05 | Covidien Lp | System and method for memory switching for multiple configuration medical sensor |
| US8417310B2 (en) | 2009-08-10 | 2013-04-09 | Covidien Lp | Digital switching in multi-site sensor |
| US8428675B2 (en) | 2009-08-19 | 2013-04-23 | Covidien Lp | Nanofiber adhesives used in medical devices |
| US20110211600A1 (en) * | 2010-03-01 | 2011-09-01 | Board Of Trustees Of Michigan State University | Laser system for output manipulation |
| US8630322B2 (en) | 2010-03-01 | 2014-01-14 | Board Of Trustees Of Michigan State University | Laser system for output manipulation |
| JP2012007890A (en) * | 2010-06-22 | 2012-01-12 | Seiko Epson Corp | Spectrometer |
| US8711360B2 (en) * | 2010-06-22 | 2014-04-29 | Seiko Epson Corporation | Spectral measurement device |
| US8401809B2 (en) | 2010-07-12 | 2013-03-19 | Honeywell International Inc. | System and method for adjusting an on-line appearance sensor system |
| US8649838B2 (en) | 2010-09-22 | 2014-02-11 | Covidien Lp | Wavelength switching for pulse oximetry |
| US10920242B2 (en) | 2011-02-25 | 2021-02-16 | Recombinetics, Inc. | Non-meiotic allele introgression |
| WO2013148666A1 (en) * | 2012-03-27 | 2013-10-03 | Innovative Science Tools, Inc. | Optical analyzer for identification of materials using reflectance spectroscopy |
| US8859969B2 (en) * | 2012-03-27 | 2014-10-14 | Innovative Science Tools, Inc. | Optical analyzer for identification of materials using reflectance spectroscopy |
| US20130256534A1 (en) * | 2012-03-27 | 2013-10-03 | Innovative Science Tools, Inc. | Optical analyzer for identification of materials using reflectance spectroscopy |
| EP2679982A1 (en) * | 2012-06-28 | 2014-01-01 | ELMOS Semiconductor AG | Method and sensor system for measuring the transmission properties of a transmission path of a measuring system between transmitter and recipient |
| US20150185152A1 (en) * | 2012-08-09 | 2015-07-02 | Life Technologies Corporation | Illumination Systems |
| US10660526B2 (en) | 2012-12-31 | 2020-05-26 | Omni Medsci, Inc. | Near-infrared time-of-flight imaging using laser diodes with Bragg reflectors |
| US10517484B2 (en) | 2012-12-31 | 2019-12-31 | Omni Medsci, Inc. | Semiconductor diodes-based physiological measurement device with improved signal-to-noise ratio |
| US10918287B2 (en) | 2012-12-31 | 2021-02-16 | Omni Medsci, Inc. | System for non-invasive measurement using cameras and time of flight detection |
| US10874304B2 (en) | 2012-12-31 | 2020-12-29 | Omni Medsci, Inc. | Semiconductor source based near infrared measurement device with improved signal-to-noise ratio |
| US11353440B2 (en) | 2012-12-31 | 2022-06-07 | Omni Medsci, Inc. | Time-of-flight physiological measurements and cloud services |
| US11241156B2 (en) | 2012-12-31 | 2022-02-08 | Omni Medsci, Inc. | Time-of-flight imaging and physiological measurements |
| US11160455B2 (en) | 2012-12-31 | 2021-11-02 | Omni Medsci, Inc. | Multi-wavelength wearable device for non-invasive blood measurements in tissue |
| US10820807B2 (en) | 2012-12-31 | 2020-11-03 | Omni Medsci, Inc. | Time-of-flight measurement of skin or blood using array of laser diodes with Bragg reflectors |
| US10441176B2 (en) | 2012-12-31 | 2019-10-15 | Omni Medsci, Inc. | Imaging using near-infrared laser diodes with distributed bragg reflectors |
| US10928374B2 (en) | 2012-12-31 | 2021-02-23 | Omni Medsci, Inc. | Non-invasive measurement of blood within the skin using array of laser diodes with Bragg reflectors and a camera system |
| US10677774B2 (en) | 2012-12-31 | 2020-06-09 | Omni Medsci, Inc. | Near-infrared time-of-flight cameras and imaging |
| DE102013000376A1 (en) | 2013-01-07 | 2014-07-10 | Elmos Semiconductor Ag | Apparatus for optical measurement of biometric parameters of vertebrate animal or human, has controller that outputs internal control signal as intermediate signal, whose course is evaluated to extract biometric parameter |
| DE102013019660A1 (en) | 2013-02-12 | 2014-08-14 | Elmos Semiconductor Ag | Sensor system for optical measurement of biometric parameters of animal or plant or human, has first transmitter, second transmitter and receiver, where first transmitter is operated with first feed signal of signal generator |
| US20150022817A1 (en) * | 2013-07-19 | 2015-01-22 | Quality Vision International, Inc. | Profilometer with partial coherence interferometer adapted for avoiding... |
| US9091523B2 (en) * | 2013-07-19 | 2015-07-28 | Quality Vision International, Inc. | Profilometer with partial coherence interferometer adapted for avoiding measurements straddling a null position |
| US20160334285A1 (en) * | 2014-01-24 | 2016-11-17 | Tubitak (Turkiye Bilimsel Ve Teknolojik Arastirma Kurumu) | FIBER COUPLED INTEGRATING SPHERE BASED-LASER ENERGY METER AND CALIBRATION SYSTEM (FCIS based - LEMCS) TRACEABLE TO PRIMARY LEVEL STANDARDS |
| US9874482B2 (en) * | 2014-01-24 | 2018-01-23 | Tubitak (Turkiye Bilimsel Ve Teknolojik Arastirma Kurumu) | Fiber coupled integrating sphere based-laser energy meter and calibration system (FCIS based—LEMCS) traceable to primary level standards |
| US10976240B2 (en) * | 2015-08-18 | 2021-04-13 | Tokushima University | Concentration measurement device |
| US20180217054A1 (en) * | 2015-08-18 | 2018-08-02 | Tokushima University | Concentration measurement device |
| CN107923841A (en) * | 2015-08-18 | 2018-04-17 | 国立大学法人德岛大学 | Concentration measurement apparatus |
| CN105606565A (en) * | 2016-02-25 | 2016-05-25 | 中国科学院合肥物质科学研究院 | Wavelength modulation absorption spectrum measurement device |
| CN105606565B (en) * | 2016-02-25 | 2018-07-13 | 中国科学院合肥物质科学研究院 | A kind of wavelength modulated optical absorption spectra measuring device |
| WO2018148701A1 (en) * | 2017-02-13 | 2018-08-16 | Massachusetts Institute Of Technology | Methods and system for multi-channel bio-optical sensing |
| US11690513B2 (en) | 2017-02-13 | 2023-07-04 | Massachusetts Institute Of Technology | Methods and system for multi-channel bio-optical sensing |
| US20190041722A1 (en) * | 2017-08-01 | 2019-02-07 | Zoetis Services Llc | Apparatus for analyzing a media, and associated egg identification apparatus and method |
Similar Documents
| Publication | Publication Date | Title |
|---|---|---|
| US5774213A (en) | Techniques for measuring difference of an optical property at two wavelengths by modulating two sources to have opposite-phase components at a common frequency | |
| US5692504A (en) | Method and apparatus for the analysis of glucose in a biological matrix | |
| US6064897A (en) | Sensor utilizing Raman spectroscopy for non-invasive monitoring of analytes in biological fluid and method of use | |
| US4883963A (en) | Optical analysis method and apparatus having programmable rapid random wavelength access | |
| US5372135A (en) | Blood constituent determination based on differential spectral analysis | |
| US5770454A (en) | Method and aparatus for determining an analyte in a biological sample | |
| US7079252B1 (en) | Dual beam FTIR methods and devices for use in analyte detection in samples of low transmissivity | |
| US6028311A (en) | Rapid non-invasive optical analysis using broad bandpass spectral processing | |
| US5360004A (en) | Non-invasive determination of analyte concentration using non-continuous radiation | |
| US8346329B2 (en) | Apparatus and method for noninvasive human component measurement with selectable optical length | |
| US5748308A (en) | Programmable standard for use in an apparatus and process for the noninvasive measurement of optically absorbing compounds | |
| US20060167347A1 (en) | Composite spectral measurement method and its spectral detection instrument | |
| US20090015819A1 (en) | Optical analysis system, blood analysis system and method of determining an amplitude of a principal component | |
| US6741875B1 (en) | Method for determination of analytes using near infrared, adjacent visible spectrum and an array of longer near infrared wavelengths | |
| EP1214578A1 (en) | Method for determination of analytes using near infrared, adjacent visible spectrum and an array of longer near infrared wavelengths | |
| JPH09510884A (en) | Non-invasive non-spectrophotometric infrared measurement of blood analyte concentrations | |
| JPH08254497A (en) | Method for inspecting scattered medium using intensity modulated light | |
| Spanner et al. | New concept for the non-invasive determination of physiological glucose concentrations using modulated laser diodes | |
| US6420709B1 (en) | Methods of minimizing scattering and improving tissue sampling in non-invasive testing and imaging | |
| Ramanujam et al. | Sources of phase noise in homodyne and heterodyne phase modulation devices used for tissue oximetry studies | |
| Long et al. | Comparison of step-scan and rapid-scan approaches to the measurement of mid-infrared Fourier transform vibrational circular dichroism | |
| EP1376099B1 (en) | Infrared circular dichroism measuring apparatus and method | |
| KR101792584B1 (en) | Apparatus and method of Homodyne-based multi-channel body composition analyzing | |
| Youcef-Toumi et al. | Noninvasive blood glucose analysis using near infrared absorption spectroscopy | |
| JP2002340676A (en) | Multi-channel modulation spectrometric method and multi-channel modulation spectrometric device |
Legal Events
| Date | Code | Title | Description |
|---|---|---|---|
| AS | Assignment |
Owner name: CHARTER VENTURE CAPITAL, CALIFORNIA Free format text: ASSIGNMENT OF ASSIGNORS INTEREST;ASSIGNORS:TREBINO, RICK P.;SAMPAS, NICHOLAS M.;GUSTAFSON, ERIC K.;REEL/FRAME:007746/0166;SIGNING DATES FROM 19951001 TO 19951013 |
|
| AS | Assignment |
Owner name: SAMPAS, NICHOLAS M., CALIFORNIA Free format text: ASSIGNMENT OF ASSIGNORS INTEREST;ASSIGNOR:CHARTER VENTURE CAPITAL;REEL/FRAME:008155/0038 Effective date: 19960724 Owner name: TREBINO, RICK P., CALIFORNIA Free format text: ASSIGNMENT OF ASSIGNORS INTEREST;ASSIGNOR:CHARTER VENTURE CAPITAL;REEL/FRAME:008155/0038 Effective date: 19960724 Owner name: GUSTAFSON, ERIC K., CALIFORNIA Free format text: ASSIGNMENT OF ASSIGNORS INTEREST;ASSIGNOR:CHARTER VENTURE CAPITAL;REEL/FRAME:008155/0038 Effective date: 19960724 |
|
| REMI | Maintenance fee reminder mailed | ||
| LAPS | Lapse for failure to pay maintenance fees | ||
| STCH | Information on status: patent discontinuation |
Free format text: PATENT EXPIRED DUE TO NONPAYMENT OF MAINTENANCE FEES UNDER 37 CFR 1.362 |
|
| FP | Lapsed due to failure to pay maintenance fee |
Effective date: 20020630 |